Group Management Report Products Safety and Health Environment Human Resources Social Commitment Consolidated Financial Statements 53
While the changed average exchange rates for the year had
a limited effect on the items on the income statement
in 2017, differences in the exchange rates on December 31,
2017, had noticeable effects on the balance-sheet items
compared to the previous year. The year-end exchange rate
of the U.S. dollar was 1.20 U.S. dollars for one euro, con-
siderably higher than the exchange rate at the end of 2016
(1.05 U.S. dollars for one euro).
Business Performance
Group Sales Performance
Group sales amounted to € 2,247.0 million in 2017, an 8 %
or 171.6 million increase over the previous year (€ 2,075.3
million). Non-operating effects generally had a positive influ-
ence on the sales growth. The acquisitions of the PolyAd
companies (BYK division) and the integration of the new ac-
tivities acquired in the U.S. and China into the ELANTAS
division resulted in a sales increase of 2 % compared to the
previous year. The integration of the Addcomp companies
into the BYK division in the middle of 2016 also made a contribution,
as they were incorporated in the Consolidated
Financial Statements for a full year for the first time in the
2017 fiscal year. In contrast, Group sales decreased slightly
due to the sale of the ACTEGA Colorchemie group completed
in 2016. The positive acquisition effects were partially offset
by burdens due to exchange-rate changes. Slight sales drops
resulted particularly from the changed relations of the euro
to the Chinese renminbi and to the U.S. dollar, amounting to
1 %. Adjusted for these non-operating effects, operating
sales growth was 7 % up on the previous year. As a result, we
achieved operating sales growth above the range of 2 %
to 5 % that we had anticipated for 2017 at the beginning of
the year.
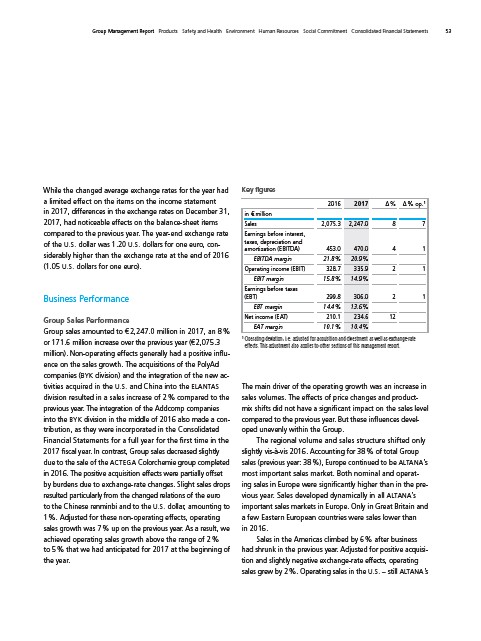
Key figures
2016 2017 Δ % Δ % op.¹
in € million
Sales 2,075.3 2,247.0 8 7
Earnings before interest,
taxes, depreciation and
amortization (EBITDA) 453.0 470.0 4 1
EBITDA margin 21.8 % 20.9 %
Operating income (EBIT) 328.7 335.9 2 1
EBIT margin 15.8 % 14.9 %
Earnings before taxes
(EBT) 299.8 306.0 2 1
EBT margin 14.4 % 13.6 %
Net income (EAT) 210.1 234.6 12
EAT margin 10.1 % 10.4 %
¹ Operating deviation, i. e. adjusted for acquisition and divestment as well as exchange-rate
effects. This adjustment also applies to other sections of this management report.
The main driver of the operating growth was an increase in
sales volumes. The effects of price changes and product-
mix shifts did not have a significant impact on the sales level
compared to the previous year. But these influences devel-
oped unevenly within the Group.
The regional volume and sales structure shifted only
slightly vis-à-vis 2016. Accounting for 38 % of total Group
sales (previous year: 38 %), Europe continued to be ALTANA’s
most important sales market. Both nominal and operat-
ing sales in Europe were significantly higher than in the previous
year. Sales developed dynamically in all ALTANA’s
important sales markets in Europe. Only in Great Britain and
a few Eastern European countries were sales lower than
in 2016.
Sales in the Americas climbed by 6 % after business
had shrunk in the previous year. Adjusted for positive acquisi-
tion and slightly negative exchange-rate effects, operating
sales grew by 2 %. Operating sales in the U.S. – still ALTANA’s