60 Business Development
the ELANTAS division, and ACTEGA’s technology purchases.
This was offset by the change of exchange-rate relations on
the balance-sheet date. Property, plant and equipment de-
creased slightly to € 774.4 million (previous year: € 781.1 mil-
lion), primarily on account of exchange-rate effects.
On December 31, 2017, non-current assets totaled
€ 2,021.6 million (previous year: € 1,831.0 million),
€ 190.5 million higher than in the previous year. Their share
in total assets was 64 % on the balance-sheet date (previ-
ous year: 60 %).
The change in current assets was influenced particularly
by the change in the amount of cash and cash equiva-
lents and short-term financial assets, as well as a change in
net working capital. In the course of the year, cash and
cash equivalents decreased to € 275.7 million due to company
and technology acquisitions (previous year: € 375.6 mil-
lion). The short-term financial assets that at the end of 2016
were still used as a time-deposit investment with a term of
more than three months were also used as financing in 2017.
Both inventories and trade accounts receivable in-
creased in the course of the growth of business activity. The
ratio of the total net working capital, in relation to the business
development of the previous three months, and taking in-
to account trade accounts payable, was 101 days and thus
at the level of the end of 2016 (previous year: 102 days). The
increase in the ratio of liabilities had a positive effect. Total
current assets decreased by € 96.7 million to € 1,126.1 million
(previous year: € 1,222.8 million).
On the liabilities side, changes arose primarily due to
the earnings-related increase in equity. Group equity climbed
by € 132.0 million, or 6 %, to € 2,214.2 million (previous
year: € 2,082.2 million). The increase is attributable to the
surplus in the 2017 fiscal year, which was partially offset,
however, by negative effects from exchange-rate changes.
The equity ratio climbed to 70 % on December 31, 2017
(previous year: 68 %). At the end of 2017, liabilities from
promissory loans remained an essential component of the
debt. These liabilities were reduced further in the past fiscal
year by the scheduled repayment of a tranche (€ 32.0 million).
Total non-current liabilities decreased to € 486.6 million
(previous year: € 564.2 million). In addition to the reduced
debt, this can also be attributed to a decrease in deferred tax
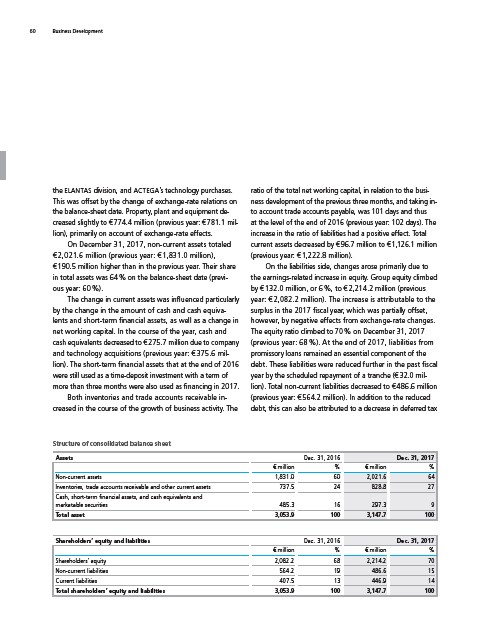
Structure of consolidated balance sheet
Assets Dec. 31, 2016 Dec. 31, 2017
€ million % € million %
Non-current assets 1,831.0 60 2,021.6 64
Inventories, trade accounts receivable and other current assets 737.5 24 828.8 27
Cash, short-term financial assets, and cash equivalents and
marketable securities 485.3 16 297.3 9
Total asset 3,053.9 100 3,147.7 100
Shareholders’ equity and liabilities Dec. 31, 2016 Dec. 31, 2017
€ million % € million %
Shareholders’ equity 2,082.2 68 2,214.2 70
Non-current liabilities 564.2 19 486.6 15
Current liabilities 407.5 13 446.9 14
Total shareholders’ equity and liabilities 3,053.9 100 3,147.7 100