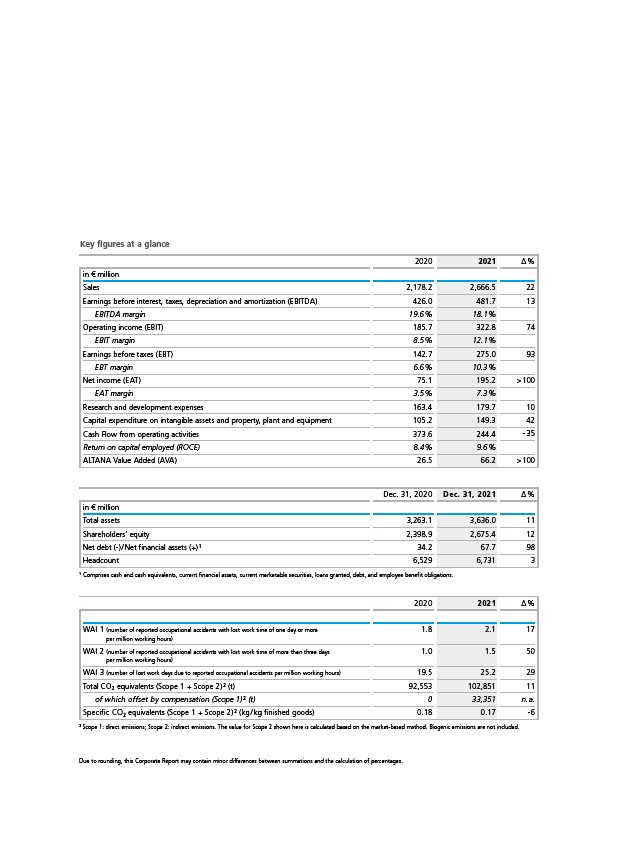
Key figures at a glance
2020 2021 Δ %
in € million
Sales 2,178.2 2,666.5 22
Earnings before interest, taxes, depreciation and amortization (EBITDA) 426.0 481.7 13
EBITDA margin 19.6 % 18.1 %
Operating income (EBIT) 185.7 322.8 74
EBIT margin 8.5 % 12.1 %
Earnings before taxes (EBT) 142.7 275.0 93
EBT margin 6.6 % 10.3 %
Net income (EAT) 75.1 195.2 > 100
EAT margin 3.5 % 7.3 %
Research and development expenses 163.4 179.7 10
Capital expenditure on intangible assets and property, plant and equipment 105.2 149.3 42
Cash Flow from operating activities 373.6 244.4
35
Return on capital employed (ROCE) 8.4 % 9.6 %
ALTANA Value Added (AVA) 26.5 66.2 > 100
Dec. 31, 2020 Dec. 31, 2021 Δ %
in € million
Total assets 3,263.1 3,636.0 11
Shareholders’ equity 2,398.9 2,675.4 12
Net debt ()
/ Net financial assets (+) ¹ 34.2 67.7 98
Headcount 6,529 6,731 3
¹ Comprises cash and cash equivalents, current financial assets, current marketable securities, loans granted, debt, and employee benefit obligations.
2020 2021 Δ %
WAI 1 (number of reported occupational accidents with lost work time of one day or more
per million working hours)
1.8 2.1 17
WAI 2 (number of reported occupational accidents with lost work time of more than three days
per million working hours)
1.0 1.5 50
WAI 3 (number of lost work days due to reported occupational accidents per million working hours) 19.5 25.2 29
Total CO² equivalents (Scope 1 + Scope 2) ² (t) 92,553 102,851 11
of which offset by compensation (Scope 1) ² (t) 0 33,351 n. a.
Specific CO² equivalents (Scope 1 + Scope 2) ² ( kg / kg finished goods) 0.18 0.17
6
² Scope 1: direct emissions; Scope 2: indirect emissions. The value for Scope 2 shown here is calculated based on the marketbased
method. Biogenic emissions are not included.
Due to rounding, this Corporate Report may contain minor differences between summations and the calculation of percentages.