to 61 % (2020: 57 %). The main focus of investment activity
was on Germany (48 %) and the U.S. (25 %). Asia’s share
of the total volume remained unchanged from 2020 at 12 %.
The BYK division invested a total of € 42.6 million in
2021, the same level as in the previous year. Investment activity
focused on the further expansion of production
capacities in Germany and on sites in China. Other investments
concerned research and development capacities as
well as strategic digitization projects.
At € 24.9 million, the ECKART division’s investment
volume was lower than in the previous year (€ 26.3 million).
As in 2020, the division’s site in the U.S. and the site in
Hartenstein accounted for by far the largest shares.
The ELANTAS division invested less in property, plant and
equipment and intangible assets (€ 11.5 million) than in
the previous year (€ 14.4 million). In the past fiscal year, the
division invested primarily in the production facilities of its
European companies.
At € 18.9 million, the ACTEGA division increased its capital
expenditure compared to 2020 (€ 16.1 million). Investments
in the past fiscal year mainly related to the expansion
of manufacturing capacities at German sites.
Balance Sheet Structure
Key figures
In the course of the 2021 fiscal year, the ALTANA Group’s
total assets rose from € 3,263.1 million to € 3,636.0
million. The increase of € 372.9 million or 11 % results pri-
marily from an increase in current assets due to the strong
growth in operating activities compared to the previous year.
Intangible assets climbed to € 995.3 million (previous
year: € 933.1 million), mainly attributable to acquisitions in
the ECKART and ACTEGA divisions. Property, plant and
equipment also increased slightly in value, developing from
€ 959.5 million in the previous year to € 997.9 million.
With additions of € 93.5 million, the level of investment in
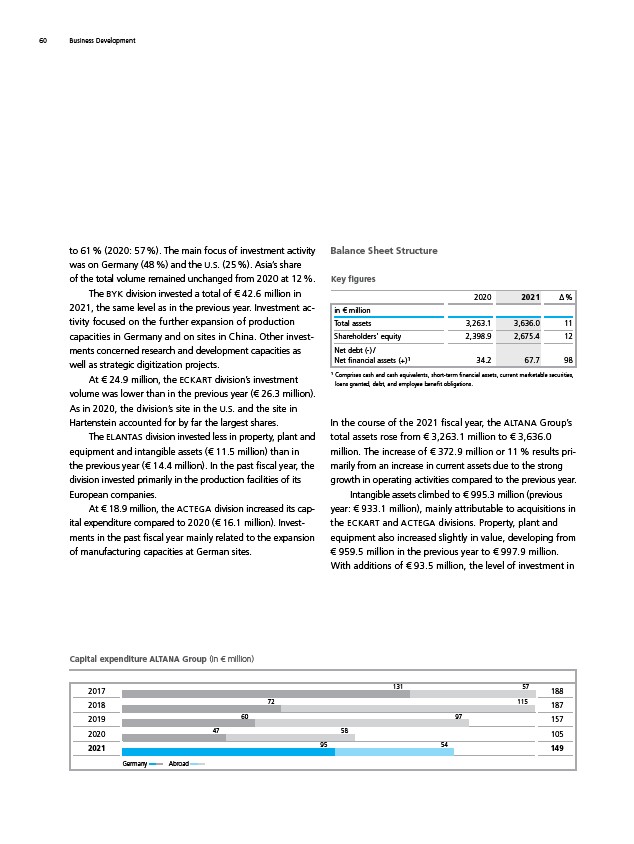
Capital expenditure ALTANA
Group (in € million)
2017 188
2018 187
2019 157
2020 105
2021 149
Germany Abroad
131 57
72 115
60 97
47 58
95 54
2020 2021 Δ %
in € million
Total assets 3,263.1 3,636.0 11
Shareholders’ equity 2,398.9 2,675.4 12
Net debt (-) /
Net financial assets (+) ¹ 34.2 67.7 98
¹ Comprises cash and cash equivalents, short-term financial assets, current marketable securities,
loans granted, debt, and employee benefit obligations.
60 Business Development