110 Multi-Year Overview
Multi-Year Overview
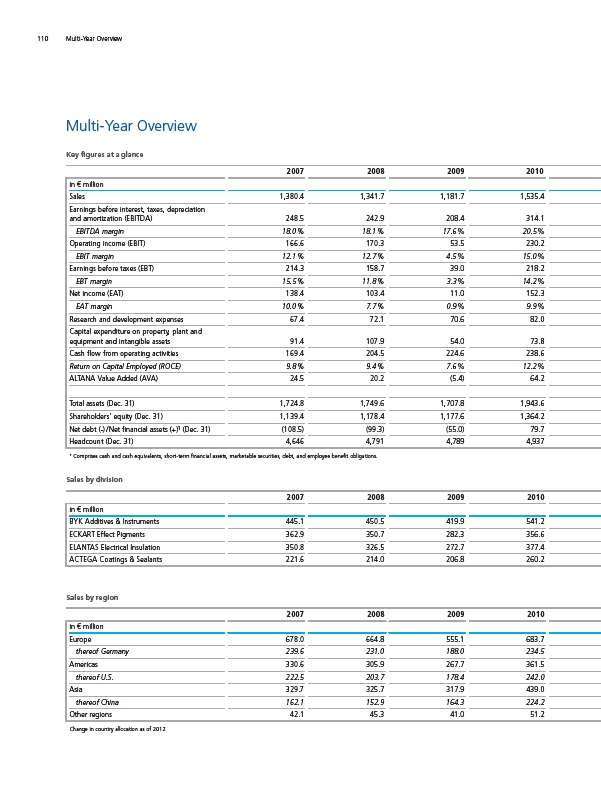
Key figures at a glance
2007 2008 2009 2010 in € million
BYK Additives & Instruments 445.1 450.5 419.9 541.2 ECKART Effect Pigments 362.9 350.7 282.3 356.6 ELANTAS Electrical Insulation 350.8 326.5 272.7 377.4 ACTEGA Coatings & Sealants 221.6 214.0 206.8 260.2 2007 2008 2009 2010 in € million
Sales 1,380.4 1,341.7 1,181.7 1,535.4 Earnings before interest, taxes, depreciation
and amortization (EBITDA) 248.5 242.9 208.4 314.1 EBITDA margin 18.0 % 18.1 % 17.6 % 20.5 % Operating income (EBIT) 166.6 170.3 53.5 230.2 EBIT margin 12.1 % 12.7 % 4.5 % 15.0 % Earnings before taxes (EBT) 214.3 158.7 39.0 218.2 EBT margin 15.5 % 11.8 % 3.3 % 14.2 % Net income (EAT) 138.4 103.4 11.0 152.3 EAT margin 10.0 % 7.7 % 0.9 % 9.9 % Research and development expenses 67.4 72.1 70.6 82.0 Capital expenditure on property, plant and
equipment and intangible assets 91.4 107.9 54.0 73.8 Cash flow from operating activities 169.4 204.5 224.6 238.6 Return on Capital Employed (ROCE) 9.8 % 9.4 % 7.6 % 12.2 % ALTANA Value Added (AVA) 24.5 20.2 (5.4) 64.2 Total assets (Dec. 31) 1,724.8 1,749.6 1,707.8 1,943.6 Shareholders’ equity (Dec. 31) 1,139.4 1,178.4 1,177.6 1,364.2 Net debt (-) / Net financial assets (+)¹ (Dec. 31) (108.5) (99.3) (55.0) 79.7 Headcount (Dec. 31) 4,646 4,791 4,789 4,937 ¹ Comprises cash and cash equivalents, short-term financial assets, marketable securities, debt, and employee benefit obligations.
Sales by division
Sales by region
2007 2008 2009 2010 in € million
Europe 678.0 664.8 555.1 683.7 thereof Germany 239.6 231.0 188.0 234.5 Americas 330.6 305.9 267.7 361.5 thereof U.S. 222.5 203.7 178.4 242.0 Asia 329.7 325.7 317.9 439.0 thereof China 162.1 152.9 164.3 224.2 Other regions 42.1 45.3 41.0 51.2 Change in country allocation as of 2012