60 Business Development
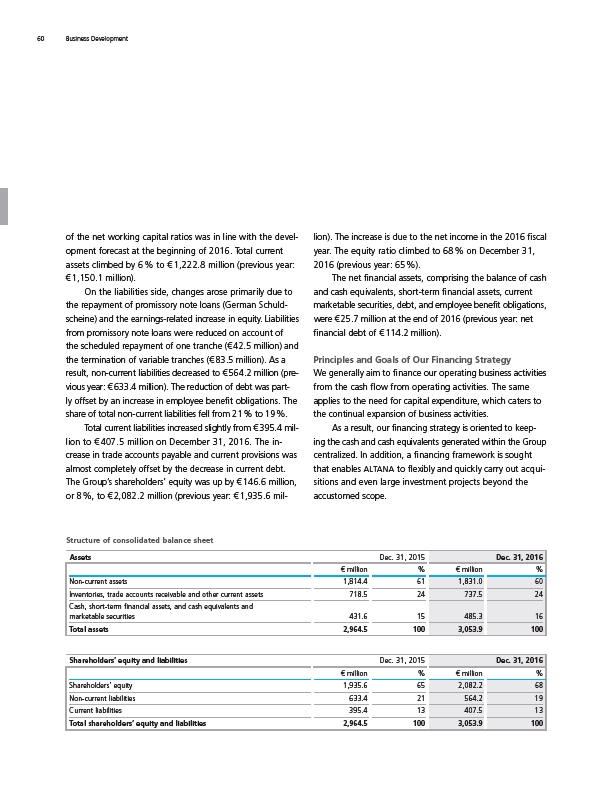
of the net working capital ratios was in line with the development
forecast at the beginning of 2016. Total current
assets climbed by 6 % to € 1,222.8 million (previous year:
€ 1,150.1 million).
On the liabilities side, changes arose primarily due to
the repayment of promissory note loans (German Schuldscheine)
and the earnings-related increase in equity. Liabilities
from promissory note loans were reduced on account of
the scheduled repayment of one tranche (€ 42.5 million) and
the termination of variable tranches (€ 83.5 million). As a
result, non-current liabilities decreased to € 564.2 million (pre-
vious year: € 633.4 million). The reduction of debt was part-
ly offset by an increase in employee benefit obligations. The
share of total non-current liabilities fell from 21 % to 19 %.
Total current liabilities increased slightly from € 395.4 million
to € 407.5 million on December 31, 2016. The in-
crease in trade accounts payable and current provisions was
almost completely offset by the decrease in current debt.
The Group’s shareholders’ equity was up by € 146.6 million,
or 8 %, to € 2,082.2 million (previous year: € 1,935.6 mil-
lion). The increase is due to the net income in the 2016 fiscal
year. The equity ratio climbed to 68 % on December 31,
2016 (previous year: 65 %).
The net financial assets, comprising the balance of cash
and cash equivalents, short-term financial assets, current
marketable securities, debt, and employee benefit obligations,
were € 25.7 million at the end of 2016 (previous year: net
financial debt of € 114.2 million).
Principles and Goals of Our Financing Strategy
We generally aim to finance our operating business activities
from the cash flow from operating activities. The same
applies to the need for capital expenditure, which caters to
the continual expansion of business activities.
As a result, our financing strategy is oriented to keep-
ing the cash and cash equivalents generated within the Group
centralized. In addition, a financing framework is sought
that enables ALTANA to flexibly and quickly carry out acqui-
sitions and even large investment projects beyond the
accustomed scope.
Structure of consolidated balance sheet
Assets Dec. 31, 2015 Dec. 31, 2016
€ million % € million %
Non-current assets 1,814.4 61 1,831.0 60
Inventories, trade accounts receivable and other current assets 718.5 24 737.5 24
Cash, short-term financial assets, and cash equivalents and
marketable securities 431.6 15 485.3 16
Total assets 2,964.5 100 3,053.9 100
Shareholders’ equity and liabilities Dec. 31, 2015 Dec. 31, 2016
€ million % € million %
Shareholders’ equity 1,935.6 65 2,082.2 68
Non-current liabilities 633.4 21 564.2 19
Current liabilities 395.4 13 407.5 13
Total shareholders’ equity and liabilities 2,964.5 100 3,053.9 100