108 Multi-Year Overview
Multi-Year Overview
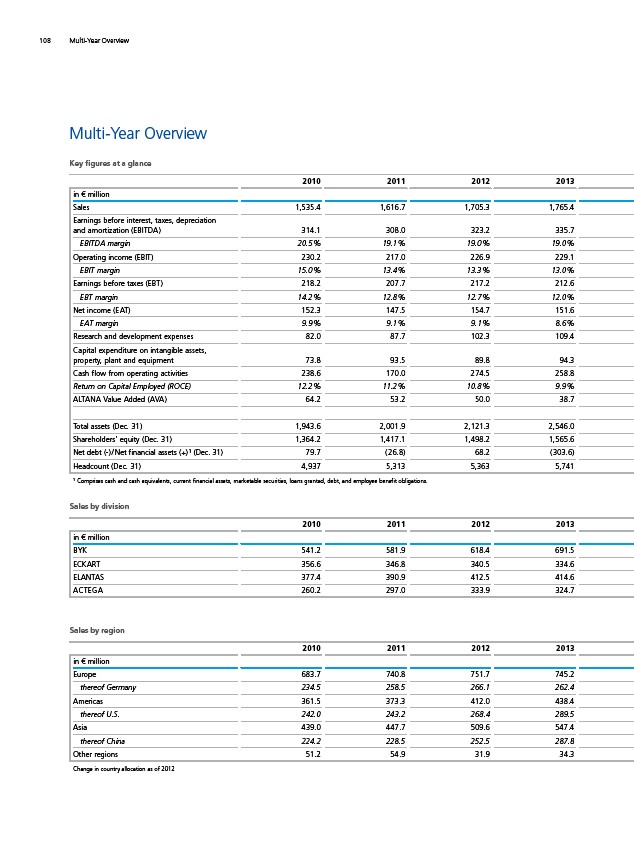
Key figures at a glance
2010 2011 2012 2013 in € million
BYK 541.2 581.9 618.4 691.5 ECKART 356.6 346.8 340.5 334.6 ELANTAS 377.4 390.9 412.5 414.6 ACTEGA 260.2 297.0 333.9 324.7 2010 2011 2012 2013 in € million
Sales 1,535.4 1,616.7 1,705.3 1,765.4 Earnings before interest, taxes, depreciation
and amortization (EBITDA) 314.1 308.0 323.2 335.7 EBITDA margin 20.5 % 19.1 % 19.0 % 19.0 % Operating income (EBIT) 230.2 217.0 226.9 229.1 EBIT margin 15.0 % 13.4 % 13.3 % 13.0 % Earnings before taxes (EBT) 218.2 207.7 217.2 212.6 EBT margin 14.2 % 12.8 % 12.7 % 12.0 % Net income (EAT) 152.3 147.5 154.7 151.6 EAT margin 9.9 % 9.1 % 9.1 % 8.6 % Research and development expenses 82.0 87.7 102.3 109.4 Capital expenditure on intangible assets,
property, plant and equipment 73.8 93.5 89.8 94.3 Cash flow from operating activities 238.6 170.0 274.5 258.8 Return on Capital Employed (ROCE) 12.2 % 11.2 % 10.8 % 9.9 % ALTANA Value Added (AVA) 64.2 53.2 50.0 38.7 Total assets (Dec. 31) 1,943.6 2,001.9 2,121.3 2,546.0 Shareholders’ equity (Dec. 31) 1,364.2 1,417.1 1,498.2 1,565.6 Net debt (-) / Net financial assets (+) ¹ (Dec. 31) 79.7 ( 26.8) 68.2 ( 303.6) Headcount (Dec. 31) 4,937 5,313 5,363 5,741 ¹ Comprises cash and cash equivalents, current financial assets, marketable securities, loans granted, debt, and employee benefit obligations.
Sales by division
Sales by region
2010 2011 2012 2013 in € million
Europe 683.7 740.8 751.7 745.2 thereof Germany 234.5 258.5 266.1 262.4 Americas 361.5 373.3 412.0 438.4 thereof U.S. 242.0 243.2 268.4 289.5 Asia 439.0 447.7 509.6 547.4 thereof China 224.2 228.5 252.5 287.8 Other regions 51.2 54.9 31.9 34.3 Change in country allocation as of 2012