Group Management Report Products Safety and Health Environment Human Resources Social Commitment Consolidated Financial Statements 55
2019 and a slightly negative influence on earnings devel-
opment. The average exchange rate of the euro to the U.S.
dollar was 1.12 U.S. dollars for one euro, down on the
previous year (1.18 U.S. dollars for one euro). Effects from
changed exchange-rate relations also resulted from a further
decline in the average exchange rate of the euro against
the Chinese renminbi, from 7.81 renminbi to 7.74 ren-
minbi for one euro. Other currencies important for key business
figures also changed in relation to the Group currency,
the euro, on average over the year. The effects of the translation
of the financial statements of major non-euro Group
companies on items of the 2019 income statement were positive
overall. Differences in exchange rates on the balance
sheet date also had a positive influence on balance sheet
items compared to the previous year.
Business Performance
Group Sales Performance
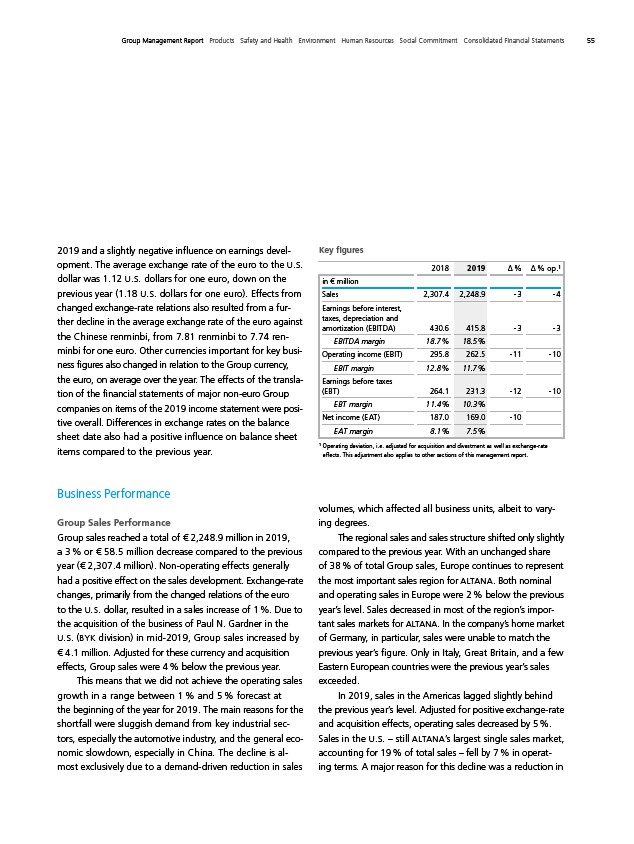
Group sales reached a total of € 2,248.9 million in 2019,
a 3 % or € 58.5 million decrease compared to the previous
year (€ 2,307.4 million). Non-operating effects generally
had a positive effect on the sales development. Exchange-rate
changes, primarily from the changed relations of the euro
to the U.S. dollar, resulted in a sales increase of 1 %. Due to
the acquisition of the business of Paul N. Gardner in the
U.S. (BYK division) in mid-2019, Group sales increased by
€ 4.1 million. Adjusted for these currency and acquisition
effects, Group sales were 4 % below the previous year.
This means that we did not achieve the operating sales
growth in a range between 1 % and 5 % forecast at
the beginning of the year for 2019. The main reasons for the
shortfall were sluggish demand from key industrial sec-
tors, especially the automotive industry, and the general economic
slowdown, especially in China. The decline is al-
most exclusively due to a demand-driven reduction in sales
Key figures
2018 2019 Δ % Δ % op.¹
in € million
Sales 2,307.4 2,248.9 - 3 - 4
Earnings before interest,
taxes, depreciation and
amortization (EBITDA) 430.6 415.8 - 3 - 3
EBITDA margin 18.7 % 18.5 %
Operating income (EBIT) 295.8 262.5 - 11 - 10
EBIT margin 12.8 % 11.7 %
Earnings before taxes
(EBT) 264.1 231.3 - 12 - 10
EBT margin 11.4 % 10.3 %
Net income (EAT) 187.0 169.0 - 10
EAT margin 8.1 % 7.5 %
¹ Operating deviation, i. e. adjusted for acquisition and divestment as well as exchange-rate
effects. This adjustment also applies to other sections of this management report.
volumes, which affected all business units, albeit to varying
degrees.
The regional sales and sales structure shifted only slightly
compared to the previous year. With an unchanged share
of 38 % of total Group sales, Europe continues to represent
the most important sales region for ALTANA. Both nominal
and operating sales in Europe were 2 % below the previous
year’s level. Sales decreased in most of the region’s impor-
tant sales markets for ALTANA. In the company’s home market
of Germany, in particular, sales were unable to match the
previous year’s figure. Only in Italy, Great Britain, and a few
Eastern European countries were the previous year’s sales
exceeded.
In 2019, sales in the Americas lagged slightly behind
the previous year’s level. Adjusted for positive exchange-rate
and acquisition effects, operating sales decreased by 5 %.
Sales in the U.S. – still ALTANA’s largest single sales market,
accounting for 19 % of total sales – fell by 7 % in operat-
ing terms. A major reason for this decline was a reduction in