Group Management Report Products Safety and Health Environment Human Resources Social Commitment Consolidated Financial Statements 61
years, major projects have been carried out for the strategic
expansion of production and laboratory capacities. Investments
in intangible assets reached € 10.3 million in the past
fiscal year, compared to € 15.2 million in 2018.
The regional distribution of investments did not change
significantly in the past fiscal year. The European share was
almost unchanged from 2018 at 49 % (previous year: 51%),
with the largest share in Europe attributable to German sites,
as in previous years. By contrast, the Americas recorded an
increase of 40 % in the 2019 fiscal year (previous year: 31 %),
while Asia’s share decreased to 11 % (previous year: 18 %).
In 2019, the BYK division invested a total of € 93.6
million, less than in the previous year (€ 118.8 million). As in
2018, the investment activity focused on the expansion
of manufacturing capacities for rheology additives in the U.S.
and on a site in China. In addition to research and development
capacities at various locations, other investments related
to a facility for carrying out automated product tests
on additives at the Wesel site and strategic digitalization projects.
At € 21.6 million (previous year: € 23.5 million), the
investment volume in the ECKART division was slightly lower
than in the previous year. By far the most significant
share was split equally between the division’s largest site in
Güntersthal and a site in the United States.
The ELANTAS division invested a significantly lower
amount in property, plant, and equipment and intangible assets
than in the previous year (€ 14.6 million compared to
€ 22.7 million in 2018). In the past fiscal year, the division in-
vested primarily at its sites in Italy and the U.S.
Investing € 23.7 million, the ACTEGA division’s capital
expenditure was at a higher level than in 2018 (€ 19.2 million).
Investments in the past fiscal year mainly related to
the expansion of manufacturing capacities and the construction
of a new innovation center at one of the division’s German
sites. More was also invested at the division’s U.S. and
Brazilian sites than in previous years.
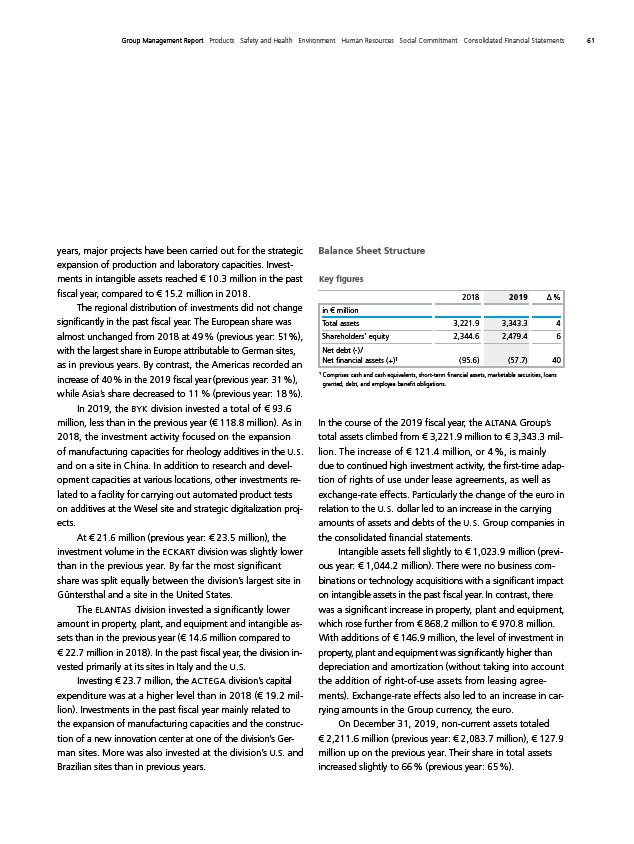
Balance Sheet Structure
Key figures
2018 2019 Δ %
in € million
Total assets 3,221.9 3,343.3 4
Shareholders’ equity 2,344.6 2,479.4 6
Net debt (-) /
Net financial assets (+)¹ ( 95.6) (57.7) 40
¹ Comprises cash and cash equivalents, short-term financial assets, marketable securities, loans
granted, debt, and employee benefit obligations.
In the course of the 2019 fiscal year, the ALTANA Group’s
total assets climbed from € 3,221.9 million to € 3,343.3 million.
The increase of € 121.4 million, or 4 %, is mainly
due to continued high investment activity, the first-time adaption
of rights of use under lease agreements, as well as
exchange-rate effects. Particularly the change of the euro in
relation to the U.S. dollar led to an increase in the carrying
amounts of assets and debts of the U.S. Group companies in
the consolidated financial statements.
Intangible assets fell slightly to € 1,023.9 million (previous
year: € 1,044.2 million). There were no business com-
binations or technology acquisitions with a significant impact
on intangible assets in the past fiscal year. In contrast, there
was a significant increase in property, plant and equipment,
which rose further from € 868.2 million to € 970.8 million.
With additions of € 146.9 million, the level of investment in
property, plant and equipment was significantly higher than
depreciation and amortization (without taking into account
the addition of right-of-use assets from leasing agreements).
Exchange-rate effects also led to an increase in carrying
amounts in the Group currency, the euro.
On December 31, 2019, non-current assets totaled
€ 2,211.6 million (previous year: € 2,083.7 million), € 127.9
million up on the previous year. Their share in total assets
increased slightly to 66 % (previous year: 65 %).