62 Business Development
The change in current assets was influenced particularly by
the decrease in net working capital. Both inventories and
trade accounts receivable fell in the past fiscal year as a result
of the decline in demand and the implementation of spe-
cific measures. The 6 % decrease in inventories to € 348.8 million
was due to a reduction in stocks of finished products
and a lower level of raw materials. The change in inventories
also had a significant impact on the development of total
net working capital. The balance of inventories, trade accounts
receivable, and trade accounts payable fell by € 14.8 mil-
lion to € 547.0 million. The ratio of net working capital, in
relation to the business development of the previous three
months, slightly decreased to 108 days, after 109 days at the
end of 2018, meaning that both the absolute net working
capital and the ratio developed in line with our expectations.
At the beginning of the year, we had forecast a change
in absolute net working capital in keeping with the general
business trend and a slight improvement in scope. Cash
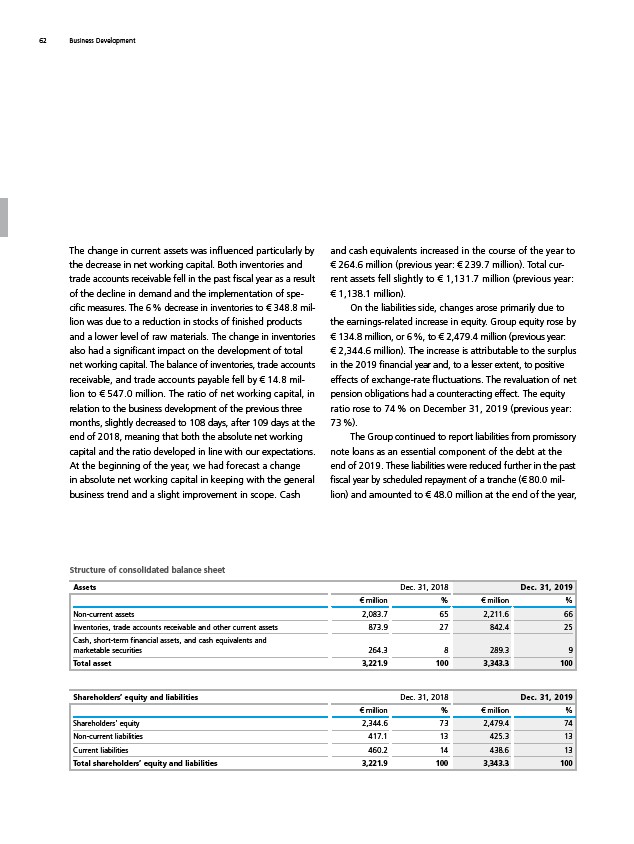
and cash equivalents increased in the course of the year to
€ 264.6 million (previous year: € 239.7 million). Total current
assets fell slightly to € 1,131.7 million (previous year:
€ 1,138.1 million).
On the liabilities side, changes arose primarily due to
the earnings-related increase in equity. Group equity rose by
€ 134.8 million, or 6 %, to € 2,479.4 million (previous year:
€ 2,344.6 million). The increase is attributable to the surplus
in the 2019 financial year and, to a lesser extent, to positive
effects of exchange-rate fluctuations. The revaluation of net
pension obligations had a counteracting effect. The equity
ratio rose to 74 % on December 31, 2019 (previous year:
73 %).
The Group continued to report liabilities from promissory
note loans as an essential component of the debt at the
end of 2019. These liabilities were reduced further in the past
fiscal year by scheduled repayment of a tranche (€ 80.0 million)
and amounted to € 48.0 million at the end of the year,
Structure of consolidated balance sheet
Assets Dec. 31, 2018 Dec. 31, 2019
€ million % € million %
Non-current assets 2,083.7 65 2,211.6 66
Inventories, trade accounts receivable and other current assets 873.9 27 842.4 25
Cash, short-term financial assets, and cash equivalents and
marketable securities 264.3 8 289.3 9
Total asset 3,221.9 100 3,343.3 100
Shareholders’ equity and liabilities Dec. 31, 2018 Dec. 31, 2019
€ million % € million %
Shareholders’ equity 2,344.6 73 2,479.4 74
Non-current liabilities 417.1 13 425.3 13
Current liabilities 460.2 14 438.6 13
Total shareholders’ equity and liabilities 3,221.9 100 3,343.3 100