exploration activities. As a result of the lower average crudeoil
price level over the year, the development of new production
sources in the U.S. declined, and so demand for the
corresponding special products of the BYK division fell sig-
nificantly compared to the previous year. In Brazil and other
major Latin American markets, however, operating sales
grew slightly vis-à-vis the previous year. Overall, the Americas’
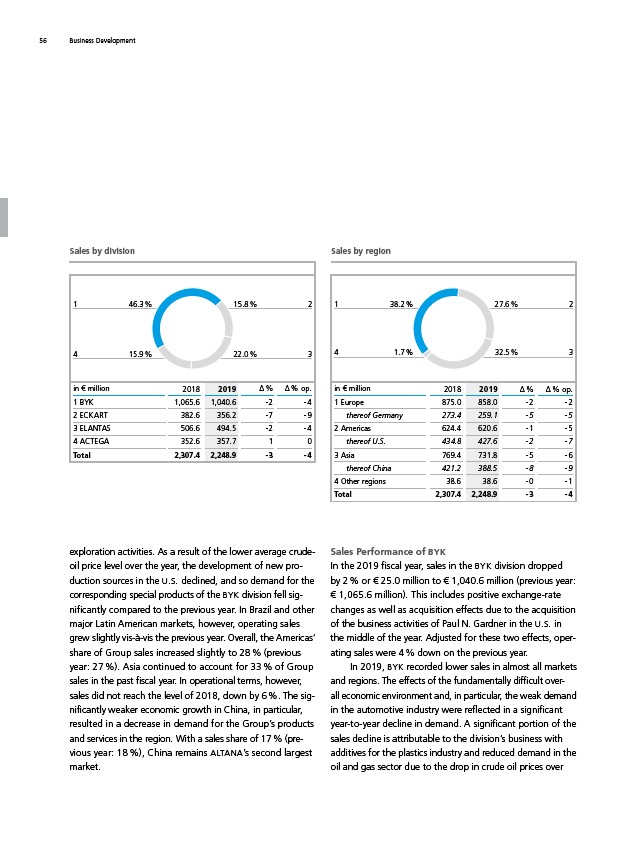
share of Group sales increased slightly to 28 % (previous
year: 27 %). Asia continued to account for 33 % of Group
sales in the past fiscal year. In operational terms, however,
sales did not reach the level of 2018, down by 6 %. The significantly
weaker economic growth in China, in particular,
resulted in a decrease in demand for the Group’s products
and services in the region. With a sales share of 17 % (pre-
vious year: 18 %), China remains ALTANA’s second largest
market.
Sales Performance of BYK
In the 2019 fiscal year, sales in the BYK division dropped
by 2 % or € 25.0 million to € 1,040.6 million (previous year:
€ 1,065.6 million). This includes positive exchange-rate
changes as well as acquisition effects due to the acquisition
of the business activities of Paul N. Gardner in the U.S. in
the middle of the year. Adjusted for these two effects, operating
sales were 4 % down on the previous year.
In 2019, BYK recorded lower sales in almost all markets
and regions. The effects of the fundamentally difficult over-
all economic environment and, in particular, the weak demand
in the automotive industry were reflected in a significant
year-to-year decline in demand. A significant portion of the
sales decline is attributable to the division’s business with
additives for the plastics industry and reduced demand in the
oil and gas sector due to the drop in crude oil prices over
Sales by division
1
4
2
3
15.8 %
22.0 %
46.3 %
15.9 %
in € million 2018 2019 Δ % Δ % op.
1 BYK 1,065.6 1,040.6 - 2 - 4
2 ECKART 382.6 356.2 - 7 - 9
3 ELANTAS 506.6 494.5 - 2 - 4
4 ACTEGA 352.6 357.7 1 0
Total 2,307.4 2,248.9 - 3 - 4
Sales by region
1
4
2
3
27.6 %
32.5 %
38.2 %
1.7 %
in € million 2018 2019 Δ % Δ % op.
1 Europe 875.0 858.0 - 2 - 2
thereof Germany 273.4 259.1 - 5 - 5
2 Americas 624.4 620.6 - 1 - 5
thereof U.S. 434.8 427.6 - 2 - 7
3 Asia 769.4 731.8 - 5 - 6
thereof China 421.2 388.5 - 8 - 9
4 Other regions 38.6 38.6 - 0 - 1
Total 2,307.4 2,248.9 - 3 - 4
56 Business Development