year: 1,718). The lower headcount particularly affected the
German sites in Hartenstein and Wackersdorf and the division’s
U.S. sites. It is attributable to the challenging economic
situation and the associated capacity utilization, as well as
corresponding countermeasures, which limited staff recruitment
to an absolute minimum in 2019.
ELANTAS recorded a slight decline of 9 employees to
1,078 (previous year: 1,087). But the development within the
division was uneven. The workforce was increased only
in manufacturing. Meanwhile, the number of employees in
other areas decreased.
In the ACTEGA division, the number of employees
remained virtually constant during the year at 1,148 (previous
year: 1,151). While the headcount increased at the German
sites in particular, the number of employees decreased
at its sites in the U.S. and Brazil.
Staff numbers of the Group holding companies climbed by
54 to 202 in the past fiscal year (previous year: 148). This
is mainly due to the expansion of the activities of the service
company implemented in the previous year at the holding
level (+ 38 employees). In 2019, the holding company took
over the financial accounting and general administration
functions for the Wesel site as well as an SAP Competence
Center. The staff had previously been employed in the BYK
division.
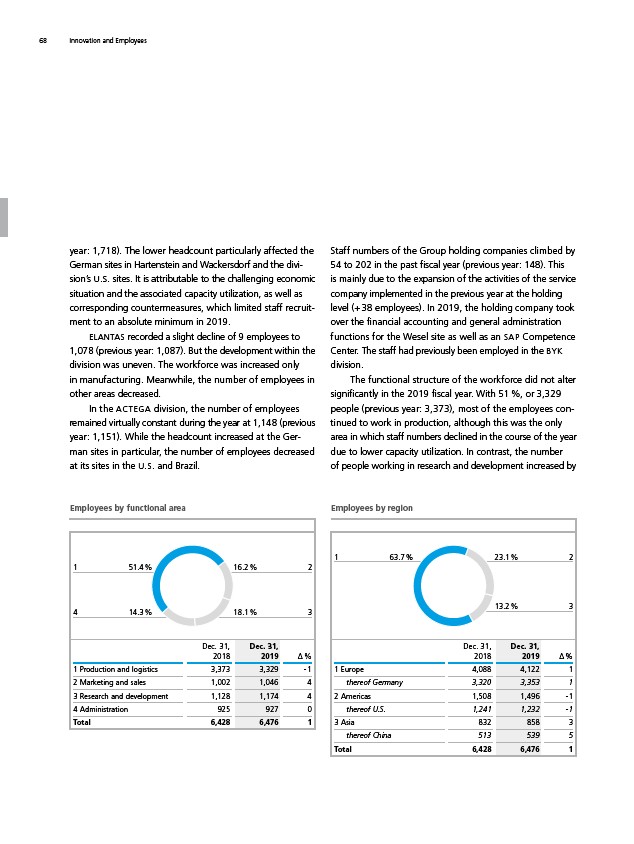
The functional structure of the workforce did not alter
significantly in the 2019 fiscal year. With 51 %, or 3,329
people (previous year: 3,373), most of the employees continued
to work in production, although this was the only
area in which staff numbers declined in the course of the year
due to lower capacity utilization. In contrast, the number
of people working in research and development increased by
Employees by functional area
1
4
2
3
16.2 %
18.1 %
51.4 %
14.3 %
Dec. 31,
2018
Dec. 31,
2019
Δ %
1 Production and logistics 3,373 3,329 - 1
2 Marketing and sales 1,002 1,046 4
3 Research and development 1,128 1,174 4
4 Administration 925 927 0
Total 6,428 6,476 1
Employees by region
1 2
3
23.1 %
13.2 %
63.7 %
Dec. 31,
2018
Dec. 31,
2019
Δ %
1 Europe 4,088 4,122 1
thereof Germany 3,320 3,353 1
2 Americas 1,508 1,496 - 1
thereof U.S. 1,241 1,232 - 1
3 Asia 832 858 3
thereof China 513 539 5
Total 6,428 6,476 1
68 Innovation and Employees