activities was significantly higher than in the previous year
(€ 296.2 million), despite the lower Group net income. This
is primarily due to the fact that the funds tied up in
net working capital were reduced in the course of the year,
whereas in the previous year the balance of inventories,
trade accounts receivable, and trade accounts payable was
still increasing. The change in inventories was the main
driver of this development. In addition, a higher proportion
of net income in the past year was attributable to noncash
expenses.
Cash flow from investment activities rose to € 228.8 mil-
lion (previous year: € 195.7 million). Although investments
in intangible assets and property, plant and equipment were
at a lower level than in the previous year, the repayment
of a loan of € 71.0 million was made in the previous year and
expenditure on acquisitions in 2019 was higher than in
the previous year.
In the 2019 fiscal year, cash flow from financing activities
amounted to € 134.6 million and was thus at the previous
year’s level (€ 135.9 million). The current debt outflows
concerned the scheduled repayment of a promissory note
tranche totaling € 80.0 million and lease payments. In the
2019 fiscal year, ALTANA AG paid a dividend amounting
to € 50.0 million (previous year: € 80.0 million).
Value Management
Key figures value management
2018 2019
in € million
Operating capital (annual average) 2,762.7 2,856.6
Operating earnings 258.6 250.1
Return on capital employed (ROCE) 9.4 % 8.8 %
Weighted average cost of capital 8.0 % 8.0 %
ALTANA
Value Added (relative AVA) 1.4 % 0.8 %
ALTANA
Value Added (absolute AVA) 37.6 21.6
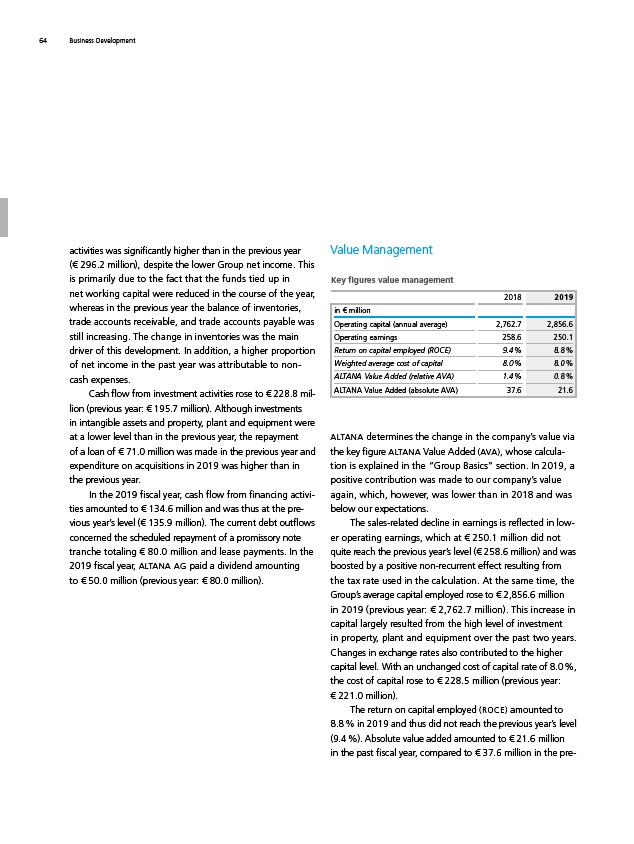
ALTANA determines the change in the company’s value via
the key figure ALTANA Value Added (AVA), whose calculation
is explained in the “Group Basics” section. In 2019, a
positive contribution was made to our company’s value
again, which, however, was lower than in 2018 and was
below our expectations.
The sales-related decline in earnings is reflected in lower
operating earnings, which at € 250.1 million did not
quite reach the previous year’s level (€ 258.6 million) and was
boosted by a positive non-recurrent effect resulting from
the tax rate used in the calculation. At the same time, the
Group’s average capital employed rose to € 2,856.6 million
in 2019 (previous year: € 2,762.7 million). This increase in
capital largely resulted from the high level of investment
in property, plant and equipment over the past two years.
Changes in exchange rates also contributed to the higher
capital level. With an unchanged cost of capital rate of 8.0 %,
the cost of capital rose to € 228.5 million (previous year:
€ 221.0 million).
The return on capital employed (ROCE) amounted to
8.8 % in 2019 and thus did not reach the previous year’s level
(9.4 %). Absolute value added amounted to € 21.6 million
in the past fiscal year, compared to € 37.6 million in the pre-
64 Business Development