Group Management Report Products Safety and Health Environment Human Resources Social Commitment Consolidated Financial Statements 59
tization and personnel expenses in sales. Outward freight
and storage costs increased, however.
Of all the functional cost areas, research and development
expenses exhibited the strongest growth in 2018,
as in the previous year. On account of the continuous expansion
of development activities in nearly all of our four divisions,
as well as the expansion of strategic activities to build
future fields of business, the ratio of research and development
costs to sales rose from 6.3 % to 6.7 %. This trend was
additionally driven by initiatives in application-oriented
research and stepped-up activities to develop new technologies
that can be used to market innovative products. In
order to successfully implement these goals, we invested in
human resources and labor in 2018, which particularly
in the functional area of research and development led to
higher personnel expenses as well as higher depreciation
and amortization.
In 2018, administrative expenses decreased compared to
2017, and the ratio of administrative expenses to sales decreased
significantly. This development was primarily due
to relatively stable personnel expenses, by far the most important
cost position, which were influenced by lower variable
salary components. In addition, travel expenses fell significantly.
The balance of other operating income and expenses
was down on the previous year. This development is almost
exclusively due to the absence of the one-off earnings of
the previous year from the reimbursement of costs from the
Renewable Energies Law (EEG).
In 2018, the level of deprecation and amortization was
the same as in the prior year. As a result, earnings before
interest and taxes (EBIT) developed on a par with the EBITDA.
The EBIT reached € 295.8 million, under the previous year’s
level (€ 335.9 million).
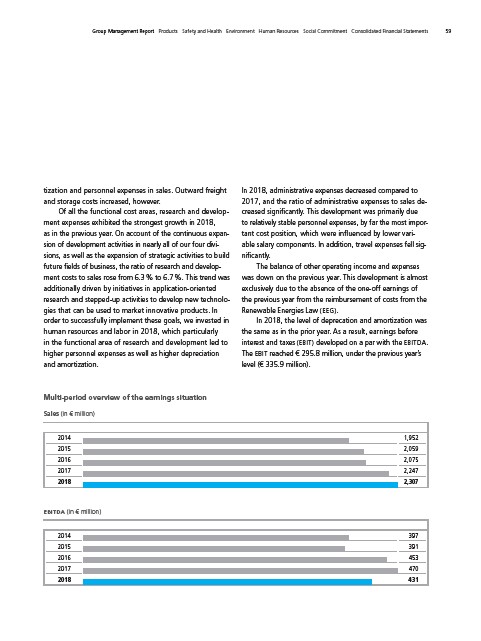
Multi-period overview of the earnings situation
Sales (in € million )
2014 1,952
2015 2,059
2016 2,075
2017 2,247
2018 2,307
EBITDA (in € million )
2014 397
2015 391
2016 453
2017 470
2018 431