to the implementation of a service company at the holding
level, in which mainly IT employees in the BYK and ECKART
divisions have been brought together so far in one ser-
vice unit.
The functional structure of the workforce did not alter
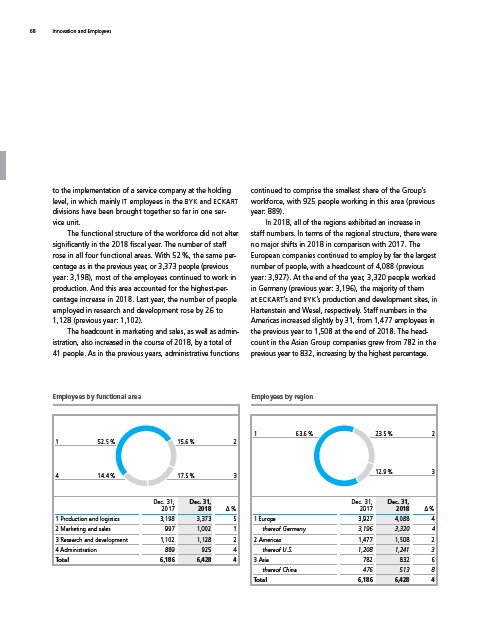
significantly in the 2018 fiscal year. The number of staff
rose in all four functional areas. With 52 %, the same percentage
as in the previous year, or 3,373 people (previous
year: 3,198), most of the employees continued to work in
production. And this area accounted for the highest-percentage
increase in 2018. Last year, the number of people
employed in research and development rose by 26 to
1,128 (previous year: 1,102).
The headcount in marketing and sales, as well as administration,
also increased in the course of 2018, by a total of
41 people. As in the previous years, administrative functions
continued to comprise the smallest share of the Group’s
workforce, with 925 people working in this area (previous
year: 889).
In 2018, all of the regions exhibited an increase in
staff numbers. In terms of the regional structure, there were
no major shifts in 2018 in comparison with 2017. The
European companies continued to employ by far the largest
number of people, with a headcount of 4,088 (previous
year: 3,927). At the end of the year, 3,320 people worked
in Germany (previous year: 3,196), the majority of them
at ECKART’s and BYK’s production and development sites, in
Hartenstein and Wesel, respectively. Staff numbers in the
Americas increased slightly by 31, from 1,477 employees in
the previous year to 1,508 at the end of 2018. The headcount
in the Asian Group companies grew from 782 in the
previous year to 832, increasing by the highest percentage.
Employees by functional area
1
4
2
3
15.6 %
17.5 %
52.5 %
14.4 %
Dec. 31,
2017
Dec. 31,
2018
Δ %
1 Production and logistics 3,198 3,373 5
2 Marketing and sales 997 1,002 1
3 Research and development 1,102 1,128 2
4 Administration 889 925 4
Total 6,186 6,428 4
Employees by region
1 2
3
23.5 %
12.9 %
63.6 %
Dec. 31,
2017
Dec. 31,
2018
Δ %
1 Europe 3,927 4,088 4
thereof Germany 3,196 3,320 4
2 Americas 1,477 1,508 2
thereof U.S. 1,208 1,241 3
3 Asia 782 832 6
thereof China 476 513 8
Total 6,186 6,428 4
68 Innovation and Employees