62 Business Development
customer relationships and software that had been acquired.
In the past fiscal year, there were no major business combinations
or technology acquisitions. On the other hand, property,
plant and equipment rose significantly, from € 774.4 million
to € 868.2 million. With additions of € 171.8 million,
the level of investment in property, plant and equipment was
significantly higher than depreciation and amortization.
Exchange
rate effects also led to an increase in the carrying
amount in the Group currency, the euro.
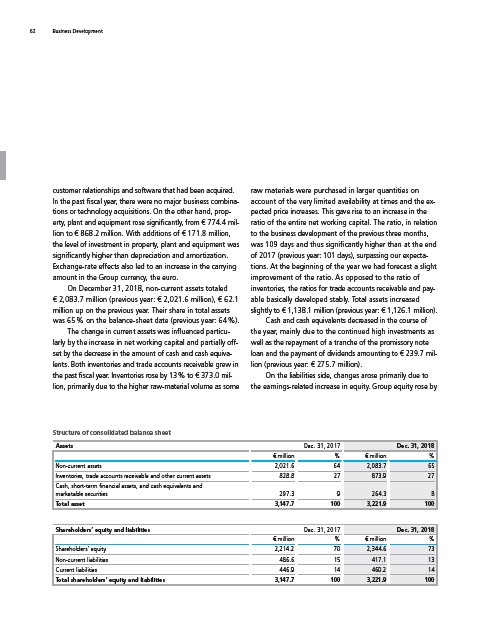
On December 31, 2018, non-current assets totaled
€ 2,083.7 million (previous year: € 2,021.6 million), € 62.1
million up on the previous year. Their share in total assets
was 65 % on the balance-sheet date (previous year: 64 %).
The change in current assets was influenced particularly
by the increase in net working capital and partially offset
by the decrease in the amount of cash and cash equivalents.
Both inventories and trade accounts receivable grew in
the past fiscal year. Inventories rose by 13 % to € 373.0 million,
primarily due to the higher raw-material volume as some
raw materials were purchased in larger quantities on
account of the very limited availability at times and the expected
price increases. This gave rise to an increase in the
ratio of the entire net working capital. The ratio, in relation
to the business development of the previous three months,
was 109 days and thus significantly higher than at the end
of 2017 (previous year: 101 days), surpassing our expectations.
At the beginning of the year we had forecast a slight
improvement of the ratio. As opposed to the ratio of
inventories, the ratios for trade accounts receivable and payable
basically developed stably. Total assets increased
slightly to € 1,138.1 million (previous year: € 1,126.1 million).
Cash and cash equivalents decreased in the course of
the year, mainly due to the continued high investments as
well as the repayment of a tranche of the promissory note
loan and the payment of dividends amounting to € 239.7 million
(previous year: € 275.7 million).
On the liabilities side, changes arose primarily due to
the earnings-related increase in equity. Group equity rose by
Structure of consolidated balance sheet
Assets Dec. 31, 2017 Dec. 31, 2018
€ million % € million %
Non-current assets 2,021.6 64 2,083.7 65
Inventories, trade accounts receivable and other current assets 828.8 27 873.9 27
Cash, short-term financial assets, and cash equivalents and
marketable securities 297.3 9 264.3 8
Total asset 3,147.7 100 3,221.9 100
Shareholders’ equity and liabilities Dec. 31, 2017 Dec. 31, 2018
€ million % € million %
Shareholders’ equity 2,214.2 70 2,344.6 73
Non-current liabilities 486.6 15 417.1 13
Current liabilities 446.9 14 460.2 14
Total shareholders’ equity and liabilities 3,147.7 100 3,221.9 100