Corporate Report 2025: Letter from the Management Board | About This Report | Sustainability Management | Corporate Bodies and Management | Report of the Supervisory Board | #DiscoverGoodChemistry | Group Management Report | Products | Safety and Health | Environment | People | Social Commitment | Consolidated Financial Statements (condensed version) | Multi-Year Overview | Global Compact: Communication on Progress (COP) | ALTANA worldwide | List of Shareholdings | Contact

General Business Setting
Overall Economic Situation
The global economy proved resilient in 2025 despite ongoing geopolitical uncertainties and structural challenges. The International Monetary Fund (IMF) estimates global growth for 2025 at 3.3 %, thus at the same level as in the previous year (3.3 %). Inflation continued to ease. At the same time, many companies demonstrated a high level of adaptability to changing trade conditions. Global supply chains were further diversified and trade flows adjusted to new political frameworks. A key driver of the global economy in 2025 was rising investment in artificial intelligence and digital infrastructure. Economic development, however, remained uneven. While growth in advanced economies remained stable at a low level, some emerging and developing countries performed better than the global average.
According to IMF estimates, economic development in the Eurozone in 2025 continued to lag behind global expectations. Following growth of 0.9 % in the previous year, economic output increased slightly to 1.4 %. In Germany, after a decline in economic output in the previous year of - 0.5 %, a slightly positive trend of 0.2 % was recorded. Persistent structural weaknesses in the manufacturing sector, only slowly rising domestic demand, and low export momentum due to global trade uncertainties continue to result in weak development. In other Eurozone markets, growth remained low but slightly positive according to the IMF, for example in Italy at 0.5 % and France at 0.8 %. Spain remained one of the most dynamic economies in the Eurozone, with 2.9 % growth.
According to the latest IMF estimates, the economies in the Americas remained at a slightly positive level in 2025, under the influence of easing inflation and structural adjustments to changed trade relations. U.S. growth is estimated by the IMF to have slightly decreased to 2.1 %, while Canada reached 1.6 %. In Latin American countries, overall growth remained at 2.4 %, on par with 2024. Brazil showed slightly lower growth than in the previous year, at 2.5 %, while Mexico recorded growth of 0.6 %, below the previous year’s level.
According to the IMF, Asia remained the largest driver of global growth in 2025, due on one hand to robust domestic demand in the major economies – particularly India – and on the other hand to stable export demand despite tense trade relations. China achieved growth of 5.0 %, as in the previous year, supported in part by targeted fiscal measures to stabilize demand. India, which grew by 6.5 % in the previous year, remained one of the fastest-growing economies worldwide, with expected growth of 7.3 %. The ASEAN-5 countries are projected to achieve growth of 4.2 % in 2025 (previous year: 4.6 %). Japan, after a decline of 0.2 % in the previous year, recorded economic growth of 1.1 % in 2025.
Industry-Specific Framework Conditions
The German Chemical Industry Association (VCI) estimates global chemical production growth at 3.5 % in the past fiscal year (previous year: 4.9 %). The chemical industry thus performed worse than in the prior year but still slightly above estimated global economic growth for 2025. Demand recovered at varying speeds across regions.
For the European market as a whole, the VCI expects a decline of 2.0 % due to ongoing structural problems, a significant deterioration from the previous year’s increase of 2.4 %. Germany, the largest chemical producer in Europe, is estimated by the VCI, following growth of 3.0 % in the previous year, to have experienced a decline of 2.5 %.
In the United States, chemical production is estimated by the VCI to have increased by 1.5 %, above the previous year’s level of 0.3 %, but below overall U.S. economic development. In Brazil, the sector is expected to have grown by 2.0 %, slightly weaker than the previous year (3.0 %).
According to the VCI, the chemical industry in the Asia-Pacific region developed unevenly in 2025. China is expected to have grown by 7.5 % in the past fiscal year (previous year: 9.1 %), whereas chemical production in India declined by - 1.0 % (previous year: 1.4 %), contrary to the overall development of the Indian economy.
The price of a barrel of Brent crude oil remained volatile throughout 2025. Persistent geopolitical tensions were offset by generally higher production and, due to globally stable but moderate growth, restrained demand. After a yearly peak of 81 U.S. dollars in January 2025, prices fluctuated strongly but continuously throughout the year. At year-end, the price of Brent crude was 61 U.S. dollars per barrel. The annual average price of 70 U.S. dollars was significantly below the previous year’s level of 81 U.S. dollars.
Important Events for Business Development
Non-operating effects impacted ALTANA’s earnings and financial situation as well as its net assets in 2025.
In the 2025 fiscal year, non-operating effects resulted from the divestment of business activities in battery protection, composite materials, and wire insulation. The sale of five entities in Germany, the United Kingdom and India was conducted in the context of the ongoing integration of the Von Roll Group, acquired in 2023, into the ELANTAS division and the associated portfolio optimization. Non-operating effects from acquisitions were not recorded in the past fiscal year.
The fluctuation of key exchange rates for ALTANA against the Group currency, the euro, had a significantly negative impact on sales and earnings development in 2025. The strongest effect in 2025 came from the change in the U.S. dollar exchange rate against the euro, which averaged USD 1.13 per euro, above the previous year’s level (USD 1.08 per euro). Other major negative effects from exchange-rate fluctuations arose from the Chinese renminbi, which averaged CNY 8.12 per euro (previous year: CNY 7.79 per euro). The same trend was observed for the Indian rupee at 98.52 INR per euro (previous year: 90.56 INR per euro), the Brazilian real at 6.31 BRL per euro (previous year: 5.83 BRL per euro), the Mexican peso at 21.67 MXN per euro (previous year: 19.83 MXN per euro), and the Japanese yen at 169.04 JPY per euro (previous year: 163.85 JPY per euro). Slightly positive effects in 2025 resulted mainly from a weaker Swiss franc exchange rate. The average Swiss franc rate to the euro declined from 0.95 CHF per euro to 0.94 CHF per euro compared to the previous year. Differences in exchange rates at the balance sheet date had a net reducing effect on balance sheet items compared with the previous year.
Business Performance
Group Sales Performance
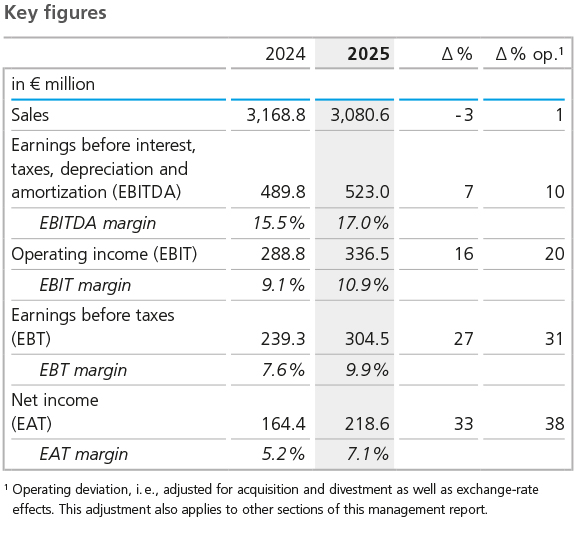
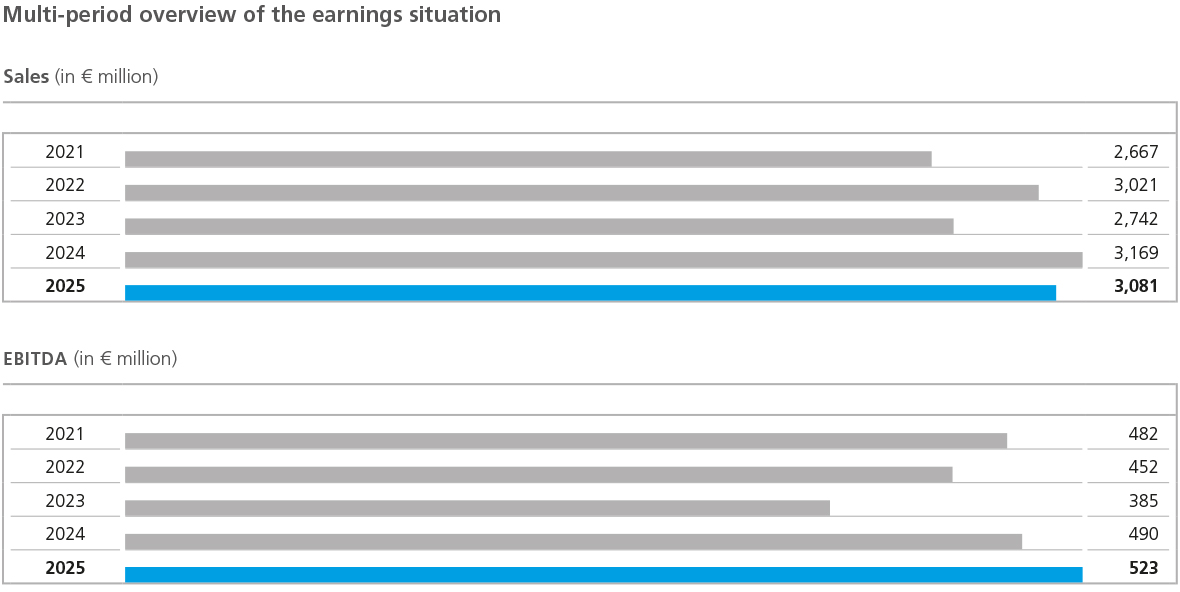
In an environment of persistently challenging market conditions, ALTANA was able to slightly increase sales on an operational basis compared to the strong previous-year figure. While Group sales in the 2025 fiscal year declined nominally compared to the previous year, adjusted for non-operating effects, growth of 1 % was achieved. Group sales totaled € 3,080.6 million, down 3 % or € 88.3 million from the previous year (€ 3,168.8 million). Non-operating effects negatively impacted the sales trend. Exchange-rate fluctuations led to a decrease of € 79.4 million from the translation of foreign-currency sales. Divestments of business activities in the ELANTAS division reduced sales by a total of € 35.8 million.
These effects were calculated based on the timing of the divestments. Demand for our products in 2025 remained below our projected expectations. At the beginning of the year, we had forecast mid-single-digit percentage sales growth for 2025, adjusted for non-operating effects, primarily driven by volume increases. Changes in product mix and selling prices had only a minor impact on ALTANA’s operational sales development in 2025 compared with the previous year.
Regional sales development in 2025 was uneven due to the specific conditions of each market, leading to further shifts in the regional sales and turnover structure. With a slightly lower share of 36 % of total Group sales (previous year: 37 %), Europe remained the most important region for ALTANA. The region recorded a 4 % decrease in sales, which, adjusted for divestments and exchange-rate effects, amounted to 2 %. Sales in Germany, the region’s largest market, also declined by 2 % adjusted for non-operating effects. Most other countries in Europe similarly recorded lower sales.
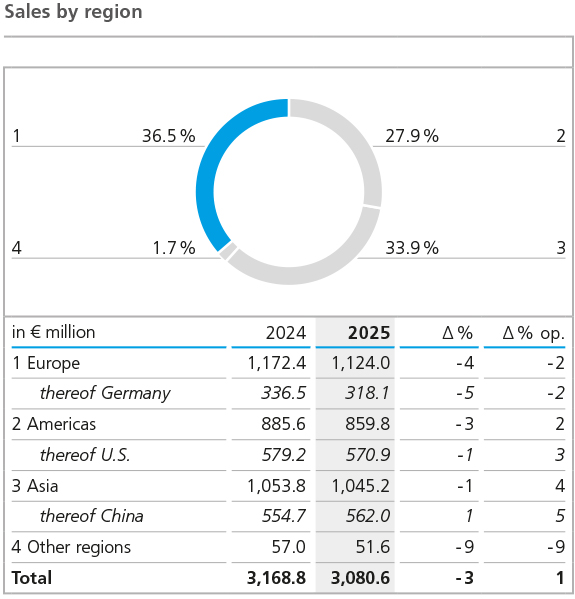
Sales in the Americas decreased by 3 % compared with the previous year. Adjusted for exchange-rate and divestment effects, however, growth of 2 % was achieved. U.S. sales rose by 3 % on an operational basis. The country’s share of total Group sales slightly increased to 19 % in 2025 (previous year: 18 %). As in the previous year, the U.S. remained the Group’s strongest single market in terms of sales. In some countries in South and Central America, sales also increased operationally. Canada slightly exceeded its previous-year level. In contrast, the major markets of Mexico and Brazil recorded sales declines of 3 % each, adjusted for non-operating effects. The Americas’ share of Group sales remained unchanged at 28 % in 2025.
The Asia region further increased its share of total Group sales from 33 % to 34 % in the past fiscal year. Although nominal sales decreased slightly by 1 %, adjusted for exchangerate fluctuations and other non-operating effects, the region achieved 4 % operational growth, the strongest increase within the Group. Key drivers were China and India, the region’s most important markets. China achieved operational growth of 5 %, with its share of total Group sales remaining at 18 %. India continued to show high dynamics, with 7 % operational growth. The highest operational growth within the Group was recorded in Japan at 8 %. In contrast, Southeast Asia, South Korea, and the Middle East countries experienced partly significant declines in sales in 2025.
Sales Performance of BYK
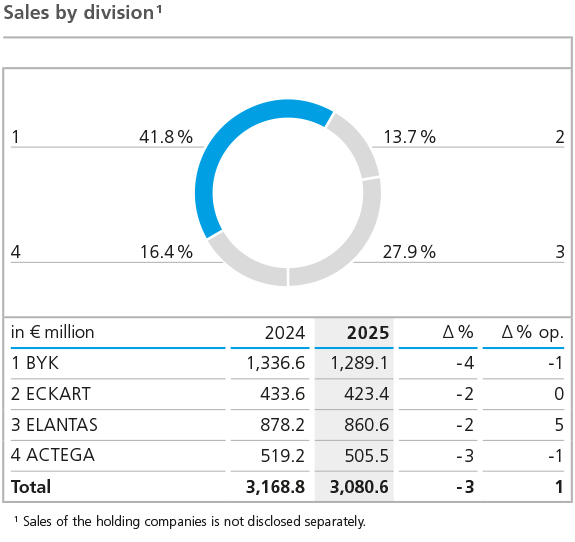
The BYK division’s sales decreased by 4 %, or € 47.6 million, to € 1,289.1 million in the 2025 fiscal year (previous year: € 1,336.6 million). This included negative exchange-rate effects of € 32.8 million. Adjusted for these effects, sales declined by 1 % in operational terms.
The decline was primarily driven by lower sales volumes. Slightly positive price and mix effects provided minor compensation. The decrease mainly affected the additives product area, particularly the plastics additives product line. In contrast, slight operational growth was achieved in the instruments business.
Sales development across regions was mixed in 2025. Asia was the only region to record operational growth and thus remained the region with the highest sales. This development was driven by the markets in China and India, which achieved mid-single-digit percentage sales growth after adjusting for exchange-rate effects. Japan and the Middle East also recorded gains, whereas other Asian markets experienced operational sales declines. Adjusted for exchange-rate effects, Europe recorded a mid-single-digit percentage decline in sales in 2025. Sales momentum slackened both in Germany, the market with the highest sales, and in most other European countries. Only France, Spain, and a few other Western European countries achieved sales growth. The Americas reported a decline in sales in the low single-digit percentage range, primarily influenced by the United States as the market with the highest sales. Adjusted for exchangerate effects, the highest percentage declines were recorded in Mexico, Brazil, and Canada. Sales growth was achieved only in a few other countries in South and Central America.
Sales Performance of ECKART
The ECKART division generated sales of € 423.4 million in 2025 (previous year: € 433.6 million). The 2 % decline compared to the previous year was primarily due to negative price and mix effects, while volume increased by 2 % year on year. Adjusted for negative exchange-rate effects, sales were only slightly below the previous-year level.
At the regional level, sales development in 2025 was highly heterogeneous. Europe, the division’s largest region, recorded a mid-single-digit percentage decline when adjusted for exchange rates, with Germany, the leading market, losing significant momentum. The Asia region was broadly stable on a currency-adjusted basis, with China, the largest market, achieving mid-single-digit operational growth. Japan recorded double-digit operational sales growth, and countries in the Middle East also posted notable increases. In contrast, India and several other Asian markets experienced single- to low-double-digit percentage declines in sales, adjusted for exchange rates. The Americas was the only region to achieve significantly positive operational growth, primarily driven by the U.S., the largest market, which recorded low-double-digit operational sales growth after adjusting for currency effects. Other countries in the region also showed dynamic operational growth. Only Brazil lost momentum and experienced double-digit operational sales declines.
Sales Performance of ELANTAS
The ELANTAS division recorded sales of € 860.6 million in 2025, down 2 % or € 17.6 million from the previous year (€ 878.2 million). The decline was largely attributable to divestments in connection with the further integration of the Von Roll Group, which decreased sales by € 35.8 million. Adjusted for negative exchange-rate effects of € 29.2 million, operational sales growth was 5 %. ELANTAS posted mid-single-digit percentage operational volume growth in 2025, while price and mix effects had a slightly additional positive impact on operational sales development.
Operational sales growth was positive across all regions, though with varying intensity. In Asia, sales, adjusted for currency and acquisition effects, grew in the mid-single-digit percentage range, driven primarily by China as the largest market. India also recorded strong momentum, with low-double-digit operational growth. Other countries in the region experienced partially significant sales declines. Europe posted low-single-digit operational growth, with Italy, the largest market, losing sales, while Germany, France, Spain, and several Eastern European countries achieved sales gains. The Americas also developed positively on an operational basis. Adjusted for currency and acquisition effects, the region grew in the high-single-digit percentage range. The leading market, the U.S., as well as all other countries in the region, contributed to strong operational growth.
Sales Performance of ACTEGA
The ACTEGA division generated sales of € 505.5 million in 2025 (previous year: € 519.2 million), a 3 % decline compared with 2024. Adjusted for negative exchange-rate effects of € 8.7 million, operational sales declined by 1 %. Volume sales slightly exceeded the previous-year level but could not offset revenue declines caused by negative price and mix effects.
Regional sales development in 2025 was highly heterogeneous. Europe, the division’s largest region, recorded a low-single-digit decline overall, with Germany, Italy, and Spain achieving low- to mid-single-digit operational growth. Poland and Turkey also grew on a currency-adjusted basis, while France and several other Western and Eastern European countries posted sales declines. The Americas recorded low-single-digit operational growth on a currency-adjusted basis. The U.S., the largest market, outperformed the region with mid-single-digit operational growth, while Canada as well as some Central and South American countries achieved low-single-digit increases. Mexico and Brazil, in contrast, recorded operational declines in the mid- and low-single-digit range, respectively. The Asia region saw a substantial loss of momentum for ACTEGA, with upper-single-digit operational sales declines. This development was primarily driven by China and the Middle East, both posting low-double-digit declines, with India and Thailand also showing weaker sales. Only Japan and several other Asian countries recorded operational sales growth.
Earnings Situation
Earnings developed positively in 2025 compared to the previous year. Material costs, measured against sales, declined slightly and thus contributed to stabilizing contribution margins despite the slight decrease in sales. Operating costs were influenced not only by tariff increases for personnel but also significantly by one-time effects, including expenses related to the further integration of companies acquired in previous years. The divestment of business activities in the ELANTAS division also led to a nominal decrease in operating costs of € 15.1 million, affecting all functional areas. In addition, positive effects arose from insurance reimbursements, particularly for damages, particularly for property damage from prior years and the related business interruptions. Driven by these overall positive effects on operating costs and other income, absolute earnings before interest, taxes, depreciation and amortization (EBITDA) increased by 7 %, or € 33.3 million, reaching € 523.0 million, above the prior-year result of € 489.8 million. Adjusted for acquisition and exchangerate effects, operational earnings growth amounted to 10 %. The EBITDA margin rose to 17.0 %, compared with 15.5 % in the previous year. The forecast for absolute EBITDA and further improvement of the EBITDA margin for 2025 was exceeded. However, the strategic target range of 18 % to 20 % could not yet be fully reached, as anticipated at the beginning of the year.
Variable raw-material and packaging costs remain ALTANA’s most significant cost factor. The material cost ratio, that is the proportion of these costs to sales, showed a volatile trend during 2025 due to fluctuating raw-material prices but remained overall below the prior-year level. In the first quarter, the ratio was 41.5 %, fluctuating to 43.5 % by the fourth quarter. For the full year, the material cost ratio averaged 42.0 %, below the prior-year value of 43.3 % and lower than forecast. Material-cost developments varied across divisions, and the cost and earnings structure in 2025 was largely influenced by one-time effects and divestments of business activities. Inflationary dynamics continued to ease slightly, though costs remained at a high level. Personnel costs decreased slightly in nominal terms compared with the previous year, mainly due to the divestment of five companies in the ELANTAS division and the corresponding reduction in workforce. Operational personnel-cost growth in the low single-digit percentage range primarily reflected tariff increases. The ratio of total personnel costs to sales rose to 24.1 % (previous year: 23.5 %), also affected by the nominal decline in sales.
Within production costs, personnel costs were below the prior-year level, primarily due to the reduction of staff following ELANTAS divestments. Operational production costs increased in the low single-digit range, mainly due to tariff increases. The ratio of production costs to sales, however, deteriorated overall due to the decline in sales.
The absolute decline in selling expenses was largely driven by lower freight costs and other volume-related expenses. Non-volume-related costs rose slightly due to tariff increases.
ALTANA increased research and development expenditures again in 2025. The rise was mainly driven by higher personnel costs. Due to the increase in expenditures and the slight nominal decline in sales, the ratio of R&D costs to total sales rose from 6.7 % to 7.0 %, matching the long-term strategic target of around 7 %.
Administrative expenses showed a slight nominal and operational decrease compared to the prior year, as tariff increases were offset by countervailing efficiency measures. The ratio of administrative costs to sales remained stable at 5.6 %.
Other operating income was primarily influenced by insurance reimbursements of € 45.4 million for property damage from prior years and the resulting business interruptions. Earnings before interest and taxes (EBIT) reached € 336.5 million (previous year: € 288.8 million), reflecting operational growth of 19.9 % compared with 2024.
The financial result stood at € - 32.8 million, below the prior-year figure of € - 17.1 million. In connection with the termination of the investment in Landa Corporation Ltd., income from the derecognition of amounts in the Other Comprehensive Income, and offsetting losses from changes in the fair value of issued loans with conversion options negatively impacted the financial result. The result from companies accounted for using the equity method improved from € - 32.4 million in the prior year to € 0.9 million. In addition, € - 65.7 million was recognized off balance sheet due to limited loss allocation.
Earnings before taxes (EBT) rose to € 304.5 million (previous year: € 239.3 million), and earnings after taxes (EAT) increased to € 218.6 million (previous year: € 164.4 million). The effective tax rate, adjusted for earnings from companies accounted for using the equity method, was 28.3 %, roughly in line with the prior-year level of 27.6 %.
Asset and Financial Situation
Capital Expenditure
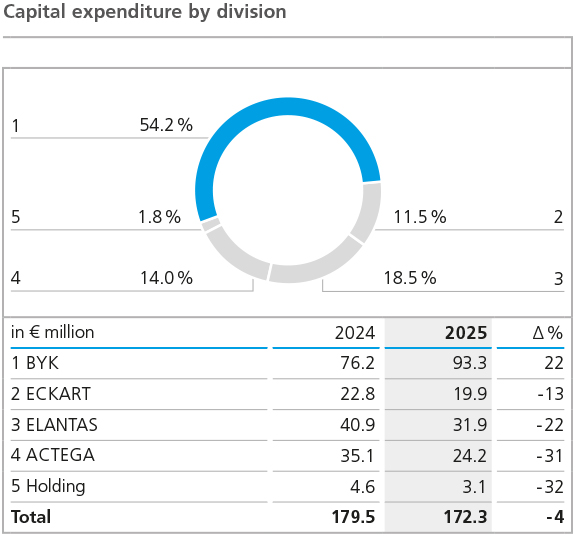
In the past fiscal year, ALTANA invested a total of € 172.3 million in intangible assets and property, plant and equipment. Capital expenditure was below the previous year’s level (€ 179.5 million). At 5.6 %, the investment ratio, that is the ratio of investments to sales, was within our long-term target range of 5 % to 6 %.
Of the total investments of € 172.3 million, € 158.0 million was allocated to property, plant and equipment (previous year: € 158.9 million). For several years, major projects have been underway to strategically expand regional production and laboratory capacities. Investments in intangible assets amounted to € 14.3 million in the reporting year, compared to € 20.6 million in 2024. The main focus in this area was the further expansion of digitalization and ERP systems.
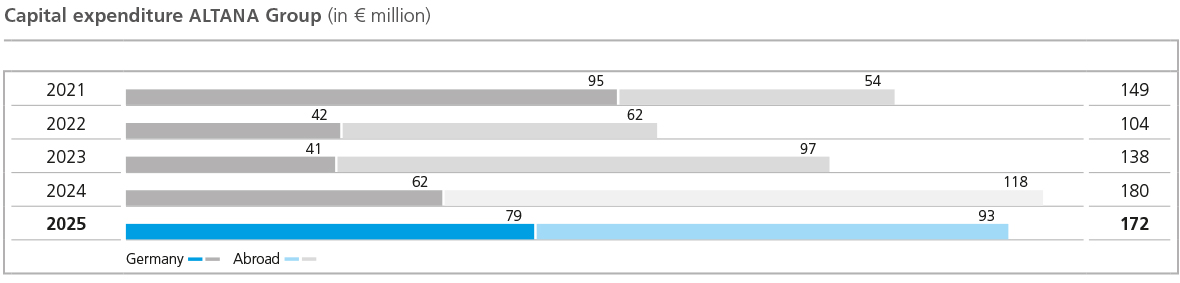
There were project-related shifts in the regional distribution of investments compared to the previous year. Europe’s share increased significantly from 54 % in 2024 to 71 % in the year under review. In contrast, Asia’s share declined to 6 % (previous year: 16 %). The Americas’ share also decreased noticeably to 23 % of the total investment volume in 2025 (2024: 29 %).
In 2025, the BYK division invested a total of € 93.3 million, significantly exceeding the previous year’s level (€ 76.2 million). The main focus of investment activities was the further expansion of production capacities in Germany, the U.S., and the Netherlands. Additional investments were made in research and development capacities and in strategic digitalization projects.
The ECKART division’s investment volume amounted to € 19.9 million, below the previous year’s figure (€ 22.8 million). As in the prior year, the majority of investments related to the division’s site in Hartenstein and its sites in the U.S.
In the ELANTAS division, investments in property, plant and equipment and intangible assets decreased to € 31.9 million (previous year: € 40.9 million). In the reporting year, the division primarily invested in its sites in Switzerland, Italy, the U.S., India, and China.
Capital expenditure in the ACTEGA division amounted to € 24.2 million (previous year: € 35.1 million). In 2025, investments mainly related to digitalization at German sites and the new site in North Carolina in the United States.
Balance Sheet Structure
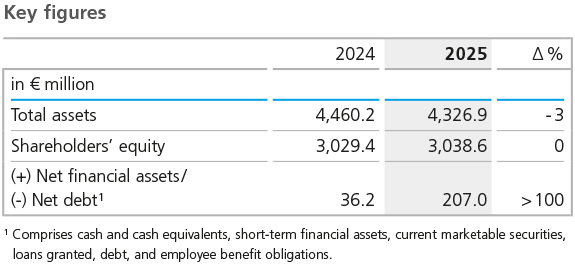
The balance sheet structure at the end of 2025 changed primarily due to company divestments, exchange-rate effects, and developments from ongoing business activities during the fiscal year. Total assets of the ALTANA Group fell from € 4,460.2 million in the previous year to € 4,326.9 million as of December 31, 2025. The decrease of € 133.3 million, or 3 %, was mainly attributable to the derecognition of assets and disposal groups held for sale in accordance with IFRS 5 in connection with company sales planned in the previous year. In addition, exchange-rate effects reduced the balance sheet total.
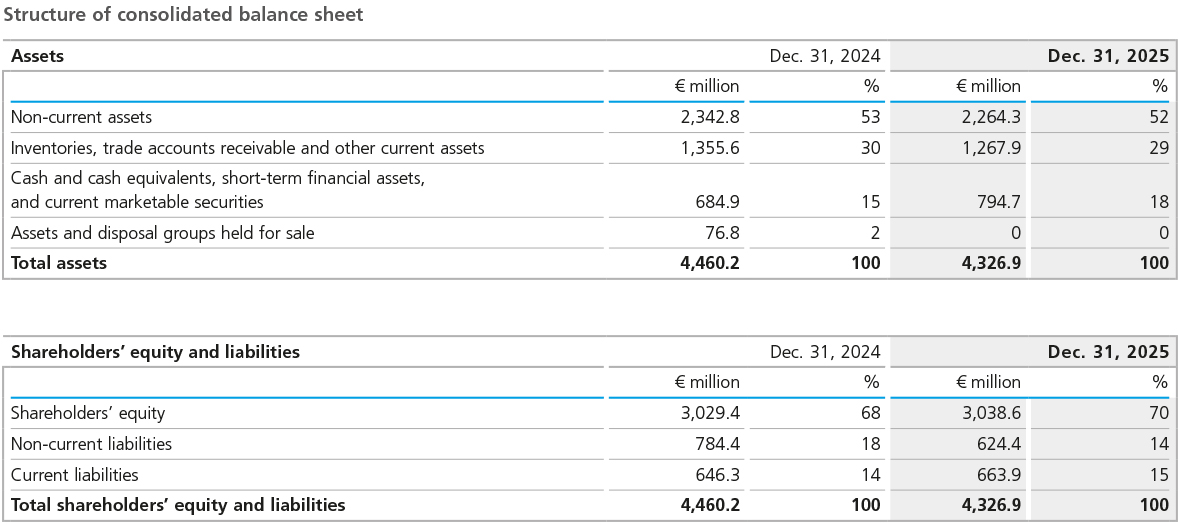
Intangible assets declined to € 920.2 million (previous year: € 1,025.9 million). Property, plant and equipment also decreased slightly, from € 1,219.9 million in the previous year to € 1,210.2 million. Additions to property, plant and equipment of € 158.0 million exceeded depreciation of € 127.3 million. On balance, negative exchange-rate effects contributed to a reduction in carrying amounts in both categories in the Group currency, the euro. Changes in closing exchange rates also had a reducing effect on long-term financial investments, which declined slightly from € 35.4 million to € 34.8 million at year-end.
Total non-current assets amounted to € 2,264.3 million as of the reporting date (previous year: € 2,342.8 million), € 78.5 million below the prior-year level. Their share of total assets decreased to 52 % (previous year: 53 %).
Current assets declined overall by € 54.8 million to € 2,062.6 million (previous year: € 2,117.4 million). The decrease resulted, among other factors, from a reduction in net working capital positions. Inventories and trade receivables declined primarily due to negative exchange-rate effects. Inventories fell from € 626.5 million in the previous year to € 585.8 million, while trade receivables decreased from € 548.5 million to € 530.2 million. Net working capital – including exchange-rate effects – decreased to € 871.4 million (previous year: € 917.3 million) when offset against current trade payables. The range of net working capital, relative to the business performance of the preceding three months, remained at 135 days, unchanged from the previous year, and was not slightly lower as forecast at the beginning of the year. Cash and cash equivalents increased during the year to € 589.6 million (previous year: € 558.2 million). As of the reporting date, no assets and disposal groups held for sale were recognized, compared to € 76.8 million at the prior-year reporting date.
On the liabilities side, changes mainly resulted from reductions in liabilities and exchange-rate-related adjustments. The Group’s equity increased slightly by € 9.1 million to € 3,038.6 million (previous year: € 3,029.4 million). A dividend of € 60.0 million was distributed in 2025. As of December 31, 2025, the equity ratio rose to 70 %, above the previous year’s level of 68 %.
Total non-current liabilities decreased during 2025 primarily due to reclassifications to current liabilities amounting to € 100.0 million and repayments of non-current bank liabilities. Repayments totaled € 45.0 million, of which € 40.0 million related to the early repayment of a promissory note loan. Overall, non-current liabilities declined by € 160.0 million to € 624.4 million (previous year: € 784.4 million).
Total current liabilities reported as of December 31, 2025, increased mainly due to reclassifications within bank liabilities, rising by € 17.6 million to € 663.9 million. Trade payables, as well as current tax provisions and other provisions, decreased significantly, primarily due to exchange-rate effects.
As of December 31, 2025, the balance of cash and cash equivalents, current financial assets, short-term securities, loans issued, financial liabilities, and pension provisions resulted in net financial assets of € 207.0 million. In particular due to the increase in cash and cash equivalents and lower bank liabilities, this represents an improvement of € 170.7 million compared to the previous year (net financial assets of € 36.2 million).
Principles and Goals of Our Financing Strategy
The financing of operating activities should generally be covered by the cash flow generated from these activities. The same applies to investment requirements that serve the continuous expansion of business activities.
Based on this, the objectives of our financing strategy are geared, on the one hand, to keeping the cash and cash equivalents generated in the Group centrally available. On the other hand, we strive for a financial framework that enables ALTANA to handle acquisitions and large investment projects that go beyond the usual scope flexibly and quickly.
To successfully implement these goals, we manage nearly all the Group’s internal financing centrally via ALTANA AG. To this end, cash pools are set up for the important currency areas.
In June 2021, ALTANA restructured its long-term Group financing: Since June 2021, ALTANA has had access to € 250.0 million in the form of a revolving credit facility from an international bank consortium. In 2023, the term was extended until 2028. This credit line had not been utilized as of December 31, 2025. In addition, ALTANA has had access to loans from the European Investment Bank (EIB) of up to € 200.0 million since the end of June 2021 for the development of climate-friendly, digital, and sustainable products. In the 2022 fiscal year, the EIB loan commitment was increased by € 50.0 million to a total of € 250.0 million and the call period was extended by one year until December 21, 2023. The EIB loans were utilized in the amount of € 210.0 million by the end of the call period; in 2025, principal payments of € 5.0 million were made. In December 2025, a new loan agreement with the EIB amounting to € 100.0 million was concluded, which had not been utilized as of the reporting date. The promissory note loan with a sustainability component issued in November 2023 in the amount of € 180.0 million has a contractual minimum term until 2026 and is divided into several tranches with different maturities. In November 2025, the promissory note loan was partially repaid early in the amount of € 40.0 million. The remaining tranches now have original maturities between three and five years and bear both variable and fixed interest rates.
This financing structure provides ALTANA with the flexibility needed to capitalize on short-term and investment heavy growth opportunities. The maturity distribution of the existing financing instruments allows us to efficiently manage liability repayments through inflows from operating cash flow.
Off-balance-sheet financing obligations arise from bank guarantees, purchase commitments, and guarantees related to employee benefit obligations. Further details regarding the existing financing instruments are provided in the Consolidated Financial Statements.
Liquidity Analysis
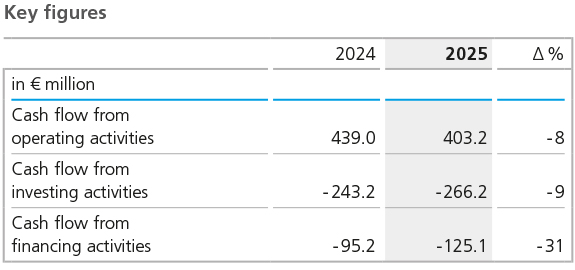
In 2025, cash and cash equivalents rose by € 31.4 million to € 589.6 million (previous year: € 558.2 million). The cash inflow from operating activities amounted to € 403.2 million, below the previous year’s level of € 439.0 million and below our expectations for the reporting period. While earnings after taxes improved, this was offset, adjusted for exchange-rate effects, by personnel-related payments, lower tax refunds compared to the previous year, and increased liquidity tied up in net working capital after adjusting for exchange-rate effects.
The cash outflow from investing activities increased compared to the prior year, amounting to € 266.2 million (previous year: € 243.2 million), whereby in the previous year payments of € 45.6 million for the acquisition of the Silberline Group were included. In the reporting year, the higher outflows mainly resulted from investments in short-term financial investments and from the granting of loans with conversion options. Investments in intangible assets and property, plant and equipment were slightly below the previous year’s level.
Cash outflow from financing activities amounted to € 125.1 million in the 2025 fiscal year, primarily due to the repayment of non-current and current liabilities and the dividend of € 60.0 million paid by ALTANA AG in 2025 (previous year: € 40.0 million). In the prior year, cash outflow from financing activities amounted to € 95.2 million.
Value Management
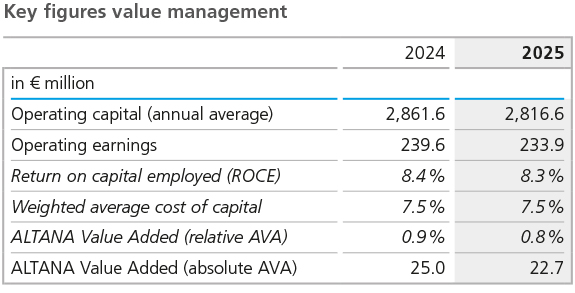
ALTANA determines the change in the company’s value via the key figure ALTANA Value Added (AVA), whose calculation is explained in the “Group Basics” section. In addition, the key figure Return on Capital Employed (ROCE), which is also presented in the “Group Basics” chapter, is used to measure the development of the company’s value.
In the 2025 fiscal year, a positive contribution to the development of the company’s value was achieved. The contribution was slightly lower than in the previous year.
The average operating capital tied up in the Group decreased slightly by 1.6 % year on year to € 2,816.6 million (previous year: € 2,861.6 million).
In the 2025 fiscal year, ALTANA generated operating income after taxes of € 233.9 million (previous year: € 239.6 million). The previously described development of EBIT, combined with a slightly improved calculated tax rate of 25.1 % (previous year: 25.7 %), adjusted for significant special effects, resulted overall in a slightly reduced earnings base relative to operating capital. The application of an unchanged cost of capital rate of 7.5 % resulted in a cost of capital of € 211.2 million (previous year: € 214.6 million).
In 2025, the return on capital employed (ROCE) amounted to 8.3 %, slightly below the prior-year figure of 8.4 %. The absolute value added amounted to € 22.7 million in the completed fiscal year, compared to € 25.0 million in the previous year. The relative AVA decreased from 0.9 % in the previous year to 0.8 % in 2025.
While the development of the average operating capital tied up in the Group met expectations, the slightly weaker operating earnings situation in the completed fiscal year meant that the forecast development of value management for 2025, which had anticipated a slightly positive trend, was not achieved.