Letter from the Management Board | About This Report | Sustainability Management | Corporate Governance | Corporate Bodies and Management | Report of the Supervisory Board | Creating Added Value at ALTANA | Group Management Report | Products | Safety and Health | Environment | Human Resources | Social Commitment | Consolidated Financial Statements (condensed version) | Multi-Year Overview | Global Compact: Communication on Progress (COP) | ALTANA worldwide | List of Full Ownership | Overview - About This Report | Contact

General Business Setting
Overall Economic Situation
In 2018, the global economy developed with a momentum comparable to that of the previous year. The International Monetary Fund (IMF) estimates that the world economy grew by 3.7 % last year (previous year: 3.8 %). But the global economic conditions steadily deteriorated in the course of the year. This trend was particularly evident in the established industrial nations. Both in the Eurozone and in Japan the economic performance was weaker than in the previous year. This burden was offset solely by the dynamic development of the U.S. economy. The emerging countries grew more strongly than the established economic nations again in 2018. The key economic indicators in the sales regions important for ALTANA’s business developed at different levels in 2018.
With expected growth of 1.8 %, the Eurozone posted significantly lower growth than in 2017 (2.4 %). All of the important European economies underwent a similar economic development. According to the IMF, Germany’s economic growth was particularly subdued. At 1.5 %, it was well below the good previous year (2.5 %). But the overall downturn in growth in Europe was also driven by other important economies in the Eurozone such as France and Italy.
According to current IMF estimates, the economic dynamic in the countries of the Americas was generally at a stable level. Only the U.S. economy grew, from 2.2 % in the previous year to 2.9 % in 2018. This development is based on a palpable improvement of private consumption and on companies’ growing inclination to invest. Economic growth in the important Latin American economies was at the same low level as the previous year. The Brazilian economy remained stable, 1.3 % up on the previous year. The same applies to Mexico and the entire Latin American economic region.
Growth in Asia was also stable. The growth rate of the large emerging economic nation China fell from 6.9 % in the previous year to 6.6 % in 2018. Growth in India, however, rose, from 6.7 % in 2017 to 7.3 % last year. Together with the countries of the ASEAN-5 economic region, these nations continue to constitute the basis of the development in the entire Asian economic area. But growth in Japan slowed, decreasing from 1.9 % to 0.9 %.
Industry-Specific Framework Conditions
According to estimates by the American Chemistry Council (ACC), global chemical manufacture increased by 2.8 % in the past fiscal year, achieving lower growth than in the previous year (2017: 3.2 %).
In 2018, the production volume in Germany, Europe’s largest chemical manufacturer, decreased (excluding the pharmaceutical industry) by 1.5 % according to estimates by the German Chemical Industry Association, although producer prices increased. According to the ACC, other European countries that are important for the chemical industry also exhibited a clear slowdown in chemical production growth, including France and Italy.
In the U.S., chemical production increased to 3.1 % (previous year: 2.6 %) against the backdrop of improved macroeconomic conditions. In Latin America, chemical manufacture showed a constant development vis-à-vis the previous year after a few recessive years.
The chemical sector in the Asia-Pacific region was again the biggest driver of global growth. The ACC estimates that chemical production in the region grew in 2018 by
3.2 %, which, however, lagged behind the strong growth in the previous year (3.9 %). The loss of momentum is primarily due to the development of chemical production in China, whose growth decreased from 4.2 % in the previous year to only 2.5 % in 2018. By contrast, chemical manufacture increased in Korea and India, with growth of
5.2 % and 6.5 %, respectively.
From the beginning of the year to the end of the third quarter, the price of a barrel of crude oil rose from 66 U.S. dollars to 85 U.S. dollars. Hence the increasing price trend that began in mid-2017 basically continued. But this development was not uniform. There was high volatility and repeated phases in which the price moved laterally or fell slightly. In the months to follow, from October to December, however, the price decreased strongly, closing the year at around 55 U.S. dollars. Nevertheless, the average price in 2018 was significantly higher than in the previous year.
Important Events for Business Development
In 2018, non-operating effects influenced ALTANA’s earnings and financial situation as well as its assets.
Acquisitions in 2017 of U.S. and German PolyAd companies (BYK division), of Solvay’s insulating resin business, and a further acquisition of wire enamel activities in China (both by the ELANTAS division) again had positive effects on sales and earnings in 2018, because these activities were included in the financial statements for a full fiscal year for the first time. In addition, the successful acquisition of novel technologies in 2017, which are to be developed to the stage of market readiness in the coming years, also influenced the Group’s key performance indicators in 2018. Of primary importance in this context is the acquisition of metallography technology from the Israeli company Landa Labs.
In 2018, the development of exchange rates between the euro, the Group currency, and other currencies important for ALTANA had a negative effect on sales and earnings development. The average exchange rate of 1.18 U.S. dollars for one euro was higher than in the previous year (1.13 U.S. dollar for a euro). Effects from changed exchange-rate relations also resulted from a further increase in the average exchange rate between the euro and the Chinese renminbi from 7.63 renminbi to 7.81 renminbi for one euro. Other currencies important for key business figures also changed in relation to the Group currency, the euro. The effects from the translation of financial statements of important non-euro Group companies on items of the income statement were generally negative in 2018. However, differences in exchange rates on the balance-sheet date had a positive influence on the balance-sheet positions compared to the previous year.
Group Sales Performance
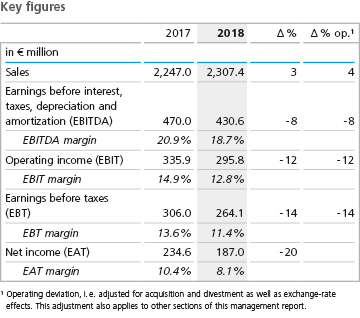
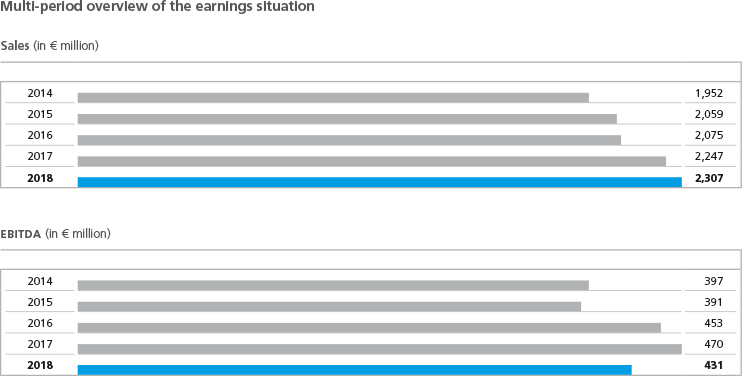
Group sales amounted to € 2,307.4 million in 2018, a 3 % or € 60.4 million increase over the previous year (€ 2,247.0 million). Non-operating effects generally had a positive influence on the sales development. The acquisition of the PolyAd companies (BYK division) in 2017 and the new activities in the ELANTAS division acquired in the U.S. and China resulted in a sales increase of 1 % over the previous year due to the fact that they were included in the consolidated financial statements for a full calendar year for the first time. But the positive acquisition effects were more than offset by burdens from exchange-rate changes. Sales drops resulted primarily from the changed relations of the euro to the U.S. dollar, to the Chinese renminbi, and to the Brazilian real, amounting to 2 % in total. Adjusted for these non-operating effects, operating sales growth was 4 % higher in a year-to-year comparison. As a result, we achieved sales growth within the 2 % to 5 % range we had anticipated for 2018 at the beginning of the year.
The operating growth was driven almost exclusively by higher sales prices and slightly positive product-mix effects. The sales volume did not change much compared to 2017, however. But these influences generally developed unevenly within the Group.
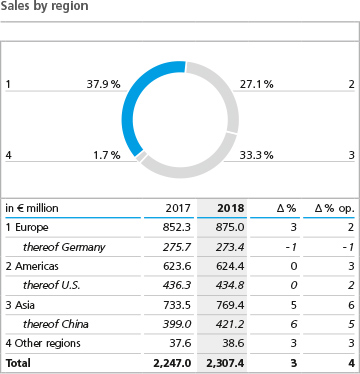
The regional volume and sales structure shifted only slightly vis-à-vis 2017. Accounting for 38 % of total Group sales, as in the previous year, Europe continued to be ALTANA’s most important sales market. Both nominal sales (+ 3 %) and operating sales (+ 2 %) in Europe were higher than in the previous year. Sales developed positively in most of ALTANA’s important sales markets in the region. Only in Germany, Great Britain, Turkey, and a few Eastern European countries were sales down on 2017.
Sales in the Americas remained almost the same as in the previous year, after business had grown significantly in 2017. Adjusted for positive acquisition and negative exchange-rate effects, operating sales grew by 3 %. Operating sales in the U.S. – still ALTANA’s largest sales market, accounting for 19 % of total sales – climbed by 2 %. A main reason for the increase was an increase in oil and gas exploration activities. On account of the increase in annual-average crude-oil prices new mining sources were tapped in the U.S., and thus the demand for specialty products from the BYK division was higher than in the previous year. In Brazil and other important Latin American markets, sales grew disproportionately compared to the prior year. Overall, the Americas accounted for 27 % of total Group sales, a slight drop from 2017
(previous year: 28 %).
Asia was responsible for 33 % of Group sales, unchanged from 2017. Recording operating growth of 6 %, Asia was the biggest growth driver of all of the regions, as in the previous year, though the sales dynamic cooled off somewhat. Sales in China, in particular, developed well, and we achieved operating growth of 5 % there. With an unchanged 18 % share of total sales, China is the Group’s second-largest sales market. Nearly all of the other Asian countries also made positive contributions to the sales growth, most notably India and Japan, each achieving operating sales growth of 10 %.
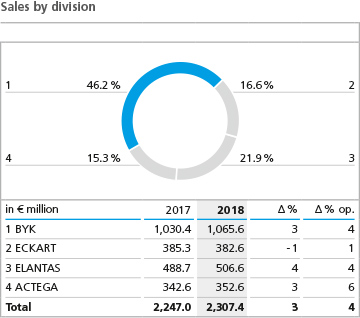
Sales Performance of BYK
In 2018, the BYK division boosted its sales by 3 %, or 35.2 million, to € 1,065.6 million (previous year: € 1,030.4 million). This increase was slightly influenced positively by the prorated effects from the acquisition of the PolyAd companies in 2017, which, however, could not completely compensate the negative burden from exchange-rate changes. Adjusted for these two effects, operating sales growth was 4 % vis-à-vis the previous year. In the course of 2018, the sales dynamic developed unevenly and noticeably flagged, especially in the second half of the year.
In all markets and nearly all regions, BYK recorded sales growth. This is primarily due to price increases and positive product-mix effects. The sales volume, however, was slightly down on the previous year. An essential factor for the sales growth was the demand in oil and gas activities. But business with additives in the plastics industry and industrial applications, as well as sales of testing and masuring instruments, also developed positively. An increasing scarcity of raw materials in the course of the year curbed growth in some product groups. The slowdown in economic growth in the second half of the year was particularly due to declining demand for applications in the automotive industry.
In terms of regions, the division’s growth was driven by Asia – and especially by the growing demand among customers in BYK’s second-largest sales market, China. Substantial sales growth was also generated in other important Asian countries, above all in Thailand, Japan, and India. While sales in Europe did not grow at the same pace as in the Asian sales region, they showed a very stable development. A slight decrease in sales in Germany, Great Britain, and Turkey was more than compensated for by other important markets on the continent. The sales performance in the Americas remained virtually the same as in the previous year. The demand in Canada and Brazil, however, was disproportionately higher than in the previous year.
Sales Performance of ECKART
Sales in the ECKART division decreased by 1 % to € 382.6 million (previous year: € 385.3 million). Adjusted for slightly negative exchange-rate effects, however, operating sales were up by 1 %. This is primarily due to price increases, which were set against negative product-mix effects. The sales volume of effect pigments was slightly lower than in the previous year.
Particularly due to steadily declining demand in the automotive industry in the second half of 2018, sales in this segment and in industrial applications were significantly lower than in 2017. Nor did sales with customers in the graphicarts industry reach the previous year’s level. However, ECKART was able to expand its activities in the cosmetics sector in the last fiscal year.
In terms of regions, the division’s operating sales varied. While Europe developed stably at the 2017 level, the Americas and Asia recorded slight operating sales growth.
Sales Performance of ELANTAS
In 2018, sales in the ELANTAS division increased by 4 %, or € 17.8 million, to € 506.6 million (previous year: € 488.7 million). The positive sales effect from the two acquisitions in the U.S. and China in 2017 was completely offset by negative exchange-rate influences, and so after adjustments operating sales increased by 4 %. The positive sales development is due to price increases and positive product-mix effects. The sales volume decreased slightly in year-to-year terms.
This development was reflected in all of the important fields of business. The division’s biggest product segment, wire enamels, accounted for the largest share of the sales growth. But sales in the electric segment also improved slightly over the previous year.
In 2018, the demand for the division’s products was generally positive in all core regions, with Asia again recording the strongest operating sales performance. Asia accounted for more than half of the division’s total sales in 2018. The sales achieved in China, ELANTAS’ most important market, and in India developed disproportionately. The sales performance in Europe was also positive overall. Sales increased in many markets. In all of the important sales markets in the Americas, ELANTAS further expanded sales in 2018. The only country with lower sales was the U.S.
Sales Performance of ACTEGA
The ACTEGA division had the highest operating sales growth of all our divisions in 2018. Nominal sales increased by 3 %, or € 10 million, to € 352.6 million (previous year:
€ 342.6 million). Adjusted for negative effects from exchange-rate fluctuations, operating sales rose by 6 %. In the course of the year, the growth dynamic developed quite positively within the division, on the one hand due to a higher sales volume, and on the other due to the improved product mix compared to the previous year, supported by a slightly positive effect from price increases that were implemented.
In the important application fields ACTEGA achieved a positive business performance. It significantly boosted some activities with functional products for food packaging. But sales decreased in business with magazines and printed supplements as well as with labels.
In 2018, the regional structure of the ACTEGA division shifted slightly in favor of Europe at the expense of the Americas. The development in the core regions was generally positive with the exception of the German sales market. Operating sales in Europe, the division’s largest region, increased significantly in the year under review. In Europe, positive sales impetus came from Italy, Spain, France, and many Eastern European countries, which more than compensated for the slightly lower sales in Germany. In the Americas, operating sales rose in the U.S. and in Brazil, the division’s two largest single markets in the region, vis-à-vis the previous year. The division also upped its sales in Asia in 2018.
Earnings Situation
The company’s operating sales growth is not reflected by the earnings situation, because the price rises that were implemented did not completely offset the strongly rising material costs in the course of the year. As a result, earnings before interest, taxes, depreciation and amortization (EBITDA) decreased vis-à-vis the strong previous year by
8 %, or € 39.4 million, to € 430.6 million (2017: € 470.0 million). Since the positive acquisition effects and the negative exchange-rate effects completely balanced each other out in the earnings, operating sales also fell by 8 % after adjustments. Nevertheless, the EBITDA margin in 2018 of 18.7 % (previous year: 20.9 %) is within our strategic target range of 18 % to 20 %.
Both the performance of the absolute EBITDA and the EBITDA margin were below our expectations. At the beginning of 2018, we had expected a result on a par with the level of sales growth and thus profitability oriented more closely to the upper edge of our strategic target range. The discrepancy to the forecast was primarily due to the unexpectedly high increase in material costs.
This important cost factor for ALTANA, which encompasses raw-materials and packaging costs, developed negatively in relative terms. The material usage ratio, the ratio of these costs to sales, increased substantially to 43.8 % in 2018 (previous year: 41.5 %). The main reasons were the steady increase in raw-materials prices in the course of the year, especially the price of oil-based raw materials and specialty products, as well as in part extreme scarcities and limited availabilities of important raw materials. This trend particularly burdened BYK, ELANTAS, and ACTEGA.
Other cost factors important for ALTANA’s earnings largely developed in proportion to sales. Personnel expenses rose only slightly, by 1 %. The ratio of total personnel expenses to sales fell to 20.9 % (previous year: 21.3 %).
In 2018, the structure of functional costs did not change significantly compared to 2017. Within production costs, external services rose disproportionately due to a number of strategic projects, as did maintenance costs due to high capacity utilization. In this area, personnel costs also rose disproportionately. But other kinds of costs that are important in production displayed a stable development or a downward trend.
In 2018, selling and distribution expenses increased slightly over the previous year, but the relative ratio to sales decreased. The drivers were lower depreciation and amortization and personnel expenses in sales. Outward freight and storage costs increased, however.
Of all the functional cost areas, research and development expenses exhibited the strongest growth in 2018, as in the previous year. On account of the continuous expansion of development activities in nearly all of our four divisions, as well as the expansion of strategic activities to build future fields of business, the ratio of research and development costs to sales rose from 6.3 % to 6.7 %. This trend was additionally driven by initiatives in application-oriented research and stepped-up activities to develop new technologies that can be used to market innovative products. In order to successfully implement these goals, we invested in human resources and labor in 2018, which particularly in the functional area of research and development led to higher personnel expenses as well as higher depreciation and amortization. In 2018, administrative expenses decreased compared to 2017, and the ratio of administrative expenses to sales decreased significantly. This development was primarily due to stable personnel expenses, as well as to the variable salary components of lower personnel expenses, by far the most important cost position. In addition, travel expenses fell significantly.
The balance of other operating income and expenses was down on the previous year. This development is almost exclusively due to the absence of the one-off earnings of the previous year from the reimbursement of costs from the Renewable Energies Law (EEG).
In 2018, the level of deprecation and amortization was the same as in the prior year. As a result, earnings before interest and taxes (EBIT) developed on a par with the EBITDA. The EBIT reached € 295.8 million, under the previous year’s level (€ 335.9 million).
The financial result was € - 7.2 million, an improvement over 2017 (€ - 8.6 million). The background for the improvement was lower interest expenses resulting from the repayment of promissory notes. On the other hand, the result of companies accounted for using the equity method worsened, from € - 21.3 million in the previous year to
€ - 24.5 million in the 2018 fiscal year. This decline is due to the fact that the Israeli Landa Corp. recorded higher losses for the year. The company’s 2018 fiscal year was burdened by the planned higher expenditure in the course of preparations for the broad-based market introduction of future digital-printing solutions.
Earnings before taxes (EBT) dropped to € 264.1 million (previous year: € 306.0 million), and net income (EAT) to € 187.0 million (previous year: € 234.6 million). Despite the earnings decline, income tax surpassed the previous year’s level. This is mainly due to the inclusion in the consolidated financial statements of the one-time positive special effect totaling € 20 million from the tax reform in the U.S.
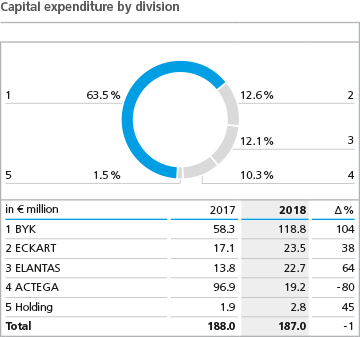
Capital Expenditure
In the past fiscal year, ALTANA invested a total of € 187.0 million in intangible assets and property, plant and equipment. As a consequence, the capital expenditure was at the same high level as in the previous year (€ 188.0 million), which in 2017 was mainly influenced by the acquisition of the metallography technology of the Israeli company Landa Labs. The investment ratio, or the ratio of investments to sales, was 8.1 % due to strategic growth projects and thus above our long-term target range of 5 % to
6 %.
Overall, € 171.8 million were invested in property, plant and equipment (previous year: € 96.4 million). Starting in 2017, large strategic projects were launched and advanced that encompass the expansion of manufacturing and laboratory capacities and that had a decisive influence on the increase in the investment level. In the past fiscal year, investments in intangible assets reached € 15.2 million, after € 91.6 million in 2017. The high level in the previous year is primarily a result of the acquisition of technology from the Israeli company Landa Labs.
In the last fiscal year, the regional distribution of investments changed significantly. The European share fell from 80 % to 51 %, and German sites again accounted for the largest share. The Americas, however, recorded a significant increase of 30 % (previous year: 14 %), while Asia’s share also rose in the 2018 fiscal year, reaching 18 % (previous year: 6 %).
In 2018, the BYK division invested a total of € 118.8 million, about twice as much as in the previous year (€ 58.3 million). The investment activity focused on the expansion of manufacturing capacities for rheology additives in the U.S. as well as the building of a new site in Shanghai in order to concentrate sales and research activities in China at one site in the future. Further investments involved research and development capacities at various sites as well as a facility for carrying out automated product tests on additives at the Wesel site.
The investment volume in the ECKART division was € 23.5 million, higher than in 2017 (previous year: € 17.1 million). By far the largest share was invested in the division’s biggest site in Güntersthal, followed by sites in the U.S. and Switzerland.
The ELANTAS division invested € 22.7 million in property, plant and equipment and intangible assets, more than in the previous year (€ 13.8 million). In the past fiscal year the focus of investment was on the division’s sites in the U.S., Italy, Germany, and India.
Investing € 19.2 million, the ACTEGA division’s capital expenditure was at a much lower level than in 2017 (€ 96.9 million). But the decrease was due solely to the acquisition in 2017 of the metallography activities and the technology portfolio for labels and packaging in the U.S. The capital expenditure in the past fiscal year mainly involved investment in capacity expansions as well as research and development labs at the division’s German sites.
Balance Sheet Structure
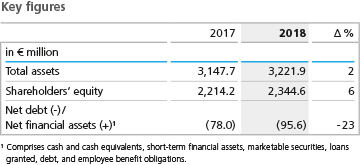
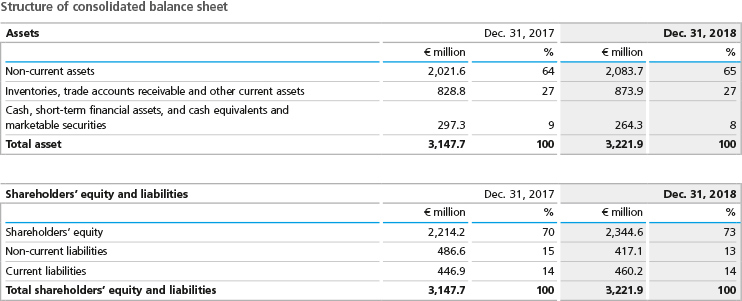
In the course of the 2018 fiscal year, the ALTANA Group’s total assets climbed from € 3,147.7 million to € 3,221.9 million. The increase of € 74.1 million, or 2 %, is mainly due to continued high investment activity and exchange-rate effects. Particularly the change of the euro in relation to the U.S. dollar led to an increase in the carrying amounts of assets and debts of the U.S. Group companies in the consolidated financial statements.
Intangible assets fell slightly to € 1,044.2 million (previous year: € 1,056.9 million). Additions resulted from the operating business and primarily involved the activation of customer relations and software that had been acquired. In the past fiscal year, there were no major company or technology acquisitions. On the other hand, property, plant and equipment rose significantly, from € 774.4 million to € 868.2 million. With additions of € 171.8 million, the level of investment in property, plant and equipment was significantly higher than depreciation and amortization. Exchange-rate effects also led to an increase in the carrying amount in the Group currency, the euro.
On December 31, 2018, non-current assets totaled € 2,083.7 million (previous year: € 2,021.6 million), € 62.1 million up on the previous year. Their share in total assets was 65 % on the balance-sheet date (previous year: 64 %).
The change in current assets was influenced particularly by the increase in net working capital and partially offset by the decrease in the amount of cash and cash equivalents. Both inventories and trade accounts receivable grew in the past fiscal year. Inventories rose by 13 % to € 373.0 million, primarily due to the higher raw-material volume as some raw materials were purchased in larger quantities on account of the very limited availability at times and the expected price increases. This gave rise to an increase in the ratio of the entire net working capital. The ratio, in relation to the business development of the previous three months, was 109 days and thus significantly higher than at the end of 2017 (previous year: 101 days), surpassing our expectations. At the beginning of the year we had forecast a slight improvement of the ratio. As opposed to the ratio of inventories, the ratios for trade accounts receivable and payable basically developed stably. Total assets increased slightly to € 1,138.1 million (previous year: € 1,126.1 million).
Cash and cash equivalents decreased in the course of the year, mainly due to the continued high investments as well as the repayment of a tranche of the promissory note loan and the payment of dividends amounting to € 239.7 million (previous year: € 275.7 million).
On the liabilities side, changes arose primarily due to the earnings-related increase in equity. Group equity rose by € 130.4 million, or 6 %, to € 2,344.6 million (previous year: € 2,214.2 million). The increase is attributable to the surplus in the 2018 fiscal year, and, to a lesser extent, to effects of exchange-rate fluctuations. The equity ratio increased to 73 % on December 31, 2018 (previous year: 70 %).
At the end of 2018, liabilities from promissory loans remained an essential component of the debt. These liabilities were reduced further in the past fiscal year by the scheduled repayment of a tranche (€ 64 million), and amounted to € 128 million at the end of the year. Due to reclassifications of the promissory note tranche due in 2019 (€ 80 million), non-current liabilities decreased to € 417.1 million (previous year: € 486.6 million). All other important non-current debt items hardly changed compared to the end of the previous year. The share of total non-current debt dropped from 15 % to 13 %.
The amount of current debt on the balance sheet increased slightly from € 446.9 million to € 460.2 million on December 31, 2018. But within current debt individual items demonstrated a contrary development. Due to the reclassification of the promissory note tranche due in 2019 (€ 80 million), current debt increased, and current accrued income tax also rose. On the other hand, other current provisions decreased, above all due to the disclosure of lower provisions for employee bonuses.
The net financial debt, comprising the balance of cash and cash equivalents, short-term financial assets, current marketable securities, loans granted, debt, and employee benefit obligations, reached € 95.6 million at the end of 2018, after net financial assets of € 78.0 million were disclosed in the previous year.
Principles and Goals of Our Financing Strategy
We generally aim to finance our operating business activities from the cash flow from operating activities. The same applies to the need for capital expenditure, which caters to the continual expansion of business activities.
As a result, our financing strategy is oriented to keeping the cash and cash equivalents generated within the Group centralized. In addition, a financing framework is sought that enables ALTANA to flexibly and quickly carry out acquisitions and even large investment projects beyond the accustomed scope.
To successfully implement these goals, we manage nearly all of the Group’s internal financing centrally via ALTANA AG. To this end, cash pools are set up for the important currency areas.
At the end of 2018, ALTANA’s liabilities totaled € 128 million due to the issuance of two promissory note loans in 2012 and 2013 (€ 350 million in total). The outstanding promissory note loans are divided into tranches with fixed interest rates and different maturities. The loans will be repaid by 2020. Furthermore, there is a general syndicated credit facility of € 250 million. The term of this credit facility will last until 2022 and had not been utilized on the balance-sheet date.
This financing structure offers ALTANA the flexibility it needs to appropriately take advantage of short-term or investment intensive growth opportunities. The distribution of the maturities of the financing instruments we use enables us to optimally control repayment of liabilities with inflows from operating cash flow.
We continue to use off-balance-sheet financing instruments to a very limited extent. These include purchasing commitments, operating leasing commitments, and guarantees for pension plans. Details on the existing financing instruments are provided in the online Consolidated Financial Statements.
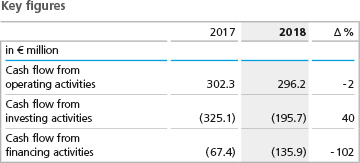
In the course of 2018, the level of cash and cash equivalents fell by € 36.0 million to € 239.7 million (previous year: € 275.7 million). Cash inflow from operating activities was € 296.2 million and thus almost on a par with the previous year (€ 302.3 million), despite the lower Group net income. This is primarily due to the fact that earnings in the previous year were favored among other things by non-cash one-off earnings in the area of income tax. In the change of net working capital positions, the effects from a relatively low increase in trade accounts receivable compared to the previous year were offset by a slower increase in trade accounts payable.
Compared to 2017, cash flow from investment activities decreased significantly to € 195.7 million (previous year: € 325.1 million). Investments in intangible assets and property, plant and equipment were at the previous year’s level, and also included larger technology acquisitions. No new business activities were acquired in the past fiscal year. The cash flow for acquisitions had reached € 141 million in 2017.
The cash flow from financing activities amounted to € 135.9 million in 2018 (previous year: € 67.4 million). The current debt outflows concerned the scheduled repayment of a promissory note tranche (€ 64.0 million) and thus were roughly the same as in the previous year. In addition to the repayment of a promissory note tranche of € 32.0 million, debt resulting from the PolyAd activities was also reduced. In the 2018 fiscal year, ALTANA AG paid a dividend amounting to € 80 million, after no dividend was paid in the previous year.
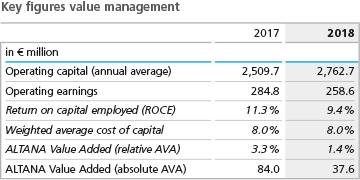
ALTANA determines the change in the company’s value via the key figure ALTANA Value Added (AVA), whose calculation is explained in the “Group Basics” section. In the 2018, a positive contribution was made to our company’s value again, which, however, was lower than in 2017 and was below our expectations.
The decline in earnings due to material costs is reflected in lower operating earnings, which at € 258.6 million did not reach the very good level of the previous year (€ 284.8 million). At the same time, the Group’s average capital employed rose to € 2,762.7 million in 2018 (previous year: € 2,509.7 million). This increase in capital largely resulted from the fact that company and technology acquisitions made in 2017 were considered in the financial statements for the first time for a full year, and due to continued high investment in property, plant and equipment. The increase in net working capital and changed exchange-rate relations also contributed to the higher capital level.
In 2018, the return on capital employed (ROCE) amounted to 9.4 % and thus did not reach the previous year’s level (11.3 %). With an unchanged cost of capital rate of
8.0 %, the relative AVA reached 1.4 % (previous year: 3.3 %).
Analogous to the expansion of the operating capital, the cost of capital rose to 221.0 million (previous year: € 200.8 million). As a result, the absolute AVA amounted to € 37.6 million in the past business year (previous year: € 84.0 million).
The slight decrease of key value figures that was forecast for 2018 due to the fact that the full capital effect of company acquisitions was considered for the first time could not be achieved, particularly due to the weaker earnings performance.
Overall Assessment of the Business Performance and the Business SituationIn the course of 2018, the macroeconomic framework conditions deteriorated increasingly. At the same time, the prices of raw materials relevant for ALTANA rose significantly due to the crude-oil price development. Nevertheless, ALTANA achieved its growth targets in this challenging business environment. However, the earnings performance did not meet our expectations because we did not fully pass on the raw-material price increases to the market. Nevertheless, we continued to make considerable investments in our strategic growth fields. Our balance sheet continued to show a very solid structure at the end of 2018 and offers sufficient financial headroom for investments in sustainable profitable growth. |